INVITE-ONLY SCRIPT
更新済 Graph Reader Pro 3.0
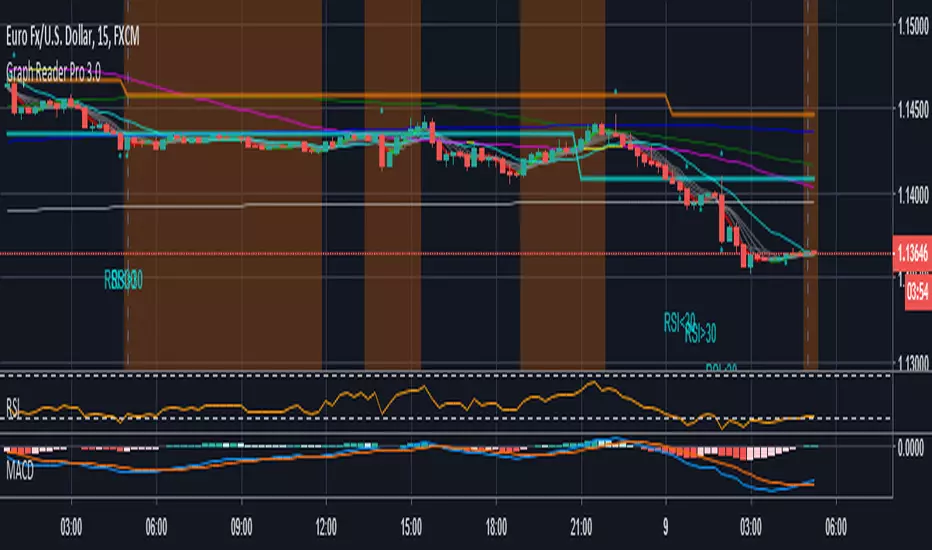
Graph Reader Pro 3.0 for TradingView gives you abilities to see the stories hiding in the graphs of the stock, forex, and crypto currency markets. It counts CC59 and creates respectable support and resistance levels as well as marks and reminds you about important parameters that are happening in the graph so that you will not forget to consider them before placing orders. These parameters include:
=================================================================================================
The source code of Graph Reader Pro 3.0 custom indicator is protected.
Only invited TradingView members can apply this indicator to their forex, crypto currency and stock price graphs.
Lifetime invitation is for 100 USD with free future upgrades and online supports.
Rental invitation is for 10 USD/month with free future upgrades and online supports.
Paypal, Bank transfer and Bitcoin payments are welcome.
For more informaton please contact the author (DrGraph or Nimit Chomnawang, PhD) via TradingView private chat
or in the comment field below.
=================================================================================================
How to install the script:
------------------------------
For normal install, follow these steps:
*Go to the bottom of this page and click on "Add to Favorite Scripts".
*Open a new chart at [ tradingview.com/chart/ ] and click on the "Indicators" tab.
*Click on the "Favorites" tab and choose "Graph Reader Pro 3.0".
*Right click anywhere on the graph, choose "Settings".
*In "Style" tab, choose the Dark Theme.
*In "Scales" tab, select Decimal Places = 1/100000.
*In "Background" tab, uncheck "Indicator Arguments" and "Indicator Values".
*In "Timezone/Sessions" tab, choose Time Zone = Your local time.
*At the bottom of settings window, click on "Template", "Save As...", then name this theme of graph setting for future call up such as "Graph Reader Pro".
*Click OK.
For free TradingView plan, you can add two more indicators to the chart. That means you may add RSI and MACD indicators with same parameters as those setup in Graph Reader Pro to your graph. DrGraph regularly publishes his educational ideas on using features provided in Graph Reader Pro for profitable investments. You can follow him for how to use the tools in trading stocks, forex, and binary options.
- Automatic CC59 counting that compares the close of the right price bar to that of left price bar in a group of 5 consecutive bars (ignoring 3 bars in the middle). If the right bar closed higher, the count positive number would be printed above the bar. If the right bar closed lower, the count negative number would be printed below the bar. Nine consecutive series of up counts will define the lowest price as CC59 support line and nine consecutive series of down counts will define the highest price as CC59 resistance line. The counted numbers, support and resistance lines are automatically printed on the graph if enabled.
- Draw the high and low levels of the previous day, if enabled. The Previous Day's High and Low are often used as reversal levels in the few future days.
- Draw the price range of each day based on Average Daily Range (ADR) value.
- Draw the price range of each week based on Average Weekly Range (AWR) value.
- Paint the background areas with active Forex trading of Asian, London, and New York sessions, if enabled.
- Draw simple moving average lines such as SMA3, with ability to change the line color based on increasing or decreasing MACD value.
- Draw simple moving average lines such as SMA50 with ability to change the line color based on increasing or decreasing prices. A set of other simple moving average lines such as SMA13, SMA200, SMA800 can be drawn if enabled.
- Draw a ribbon of simple moving average lines consisting of SMA3, SMA4, SMA5, SMA6 and SMA7, if enabled. Twisting of the SMA ribbon gives a visual signal for price reversal.
- Locate the price gaps in the graphs of stocks and indexes. The opened gaps are often closed later on. Hence, they are milestones for the price to come back and close them up.
- Locate the pin bars having the body portion less than a specific percent of the range. The pin bars show hestitation for the price to continue the current trend. When a pin bar is covered or engulfed by the next larger bar, a trend reversal offen follows.
- Automatic printing of the events happening in the graph to remind the readers of parameters under considerations (if enabled) including:
- Print "C>SMA3" and "C<SMA3" for the bars that closed above and below SMA(3).
- Print "SMA5>13" and "SMA5<13" for SMA(5) crossed above and below SMA(13).
- Print "Max" and "Min" for local maximum and local minimum bars.
- Print "RSI>70" and "RSI<70" for RSI(14) that crossed above 70 % and below 70 %.
- Print "RSI<30" and "RSI>30" for RSI(14) that crossed below 30 % and above 30 %.
- Print "RSI>50" and "RSI<50" for RSI(14) that crossed above 50 % and below 50 %.
- Print "RSI<50" and "RSI>50" for RSI(14) that crossed below 50 % and above 50 %.
- Print "MACD>0" and "MACD<0" for MACD(12,26,9) that crossed above and below zero.
- Print "MACD>Sig" and "MACD<Sig" for MACD(12,26,9) that crossed above and below their own SMA9.
=================================================================================================
The source code of Graph Reader Pro 3.0 custom indicator is protected.
Only invited TradingView members can apply this indicator to their forex, crypto currency and stock price graphs.
Lifetime invitation is for 100 USD with free future upgrades and online supports.
Rental invitation is for 10 USD/month with free future upgrades and online supports.
Paypal, Bank transfer and Bitcoin payments are welcome.
For more informaton please contact the author (DrGraph or Nimit Chomnawang, PhD) via TradingView private chat
or in the comment field below.
=================================================================================================
How to install the script:
------------------------------
For normal install, follow these steps:
*Go to the bottom of this page and click on "Add to Favorite Scripts".
*Open a new chart at [ tradingview.com/chart/ ] and click on the "Indicators" tab.
*Click on the "Favorites" tab and choose "Graph Reader Pro 3.0".
*Right click anywhere on the graph, choose "Settings".
*In "Style" tab, choose the Dark Theme.
*In "Scales" tab, select Decimal Places = 1/100000.
*In "Background" tab, uncheck "Indicator Arguments" and "Indicator Values".
*In "Timezone/Sessions" tab, choose Time Zone = Your local time.
*At the bottom of settings window, click on "Template", "Save As...", then name this theme of graph setting for future call up such as "Graph Reader Pro".
*Click OK.
For free TradingView plan, you can add two more indicators to the chart. That means you may add RSI and MACD indicators with same parameters as those setup in Graph Reader Pro to your graph. DrGraph regularly publishes his educational ideas on using features provided in Graph Reader Pro for profitable investments. You can follow him for how to use the tools in trading stocks, forex, and binary options.
リリースノート
20181109 Low body bar marking has been replaced by "Anchor Bar" marking. An anchor bar has its "Range = High - Low" larger than all that of previous 14 bars.. The text "Anchor" is printed above this bar.招待専用スクリプト
このスクリプトは作者が承認したユーザーのみアクセス可能です。使用するにはアクセス申請をして許可を得る必要があります。通常は支払い後に承認されます。詳細は下記の作者の指示に従うか、nimit.chomnawangに直接お問い合わせください。
TradingViewは、作者を完全に信頼し、スクリプトの動作を理解していない限り、有料スクリプトの購入・使用を推奨しません。コミュニティスクリプトには無料のオープンソースの代替が多数あります。
作者の指示
To get access to ProfitBee59 stock graph ai for TradingView and my other invite-only scripts, please go to [ ProfitBee59.com ].
Please do not ask about access to use scripts in the script's comment section.
Please do not ask about access to use scripts in the script's comment section.
免責事項
この情報および投稿は、TradingViewが提供または推奨する金融、投資、トレード、その他のアドバイスや推奨を意図するものではなく、それらを構成するものでもありません。詳細は利用規約をご覧ください。
招待専用スクリプト
このスクリプトは作者が承認したユーザーのみアクセス可能です。使用するにはアクセス申請をして許可を得る必要があります。通常は支払い後に承認されます。詳細は下記の作者の指示に従うか、nimit.chomnawangに直接お問い合わせください。
TradingViewは、作者を完全に信頼し、スクリプトの動作を理解していない限り、有料スクリプトの購入・使用を推奨しません。コミュニティスクリプトには無料のオープンソースの代替が多数あります。
作者の指示
To get access to ProfitBee59 stock graph ai for TradingView and my other invite-only scripts, please go to [ ProfitBee59.com ].
Please do not ask about access to use scripts in the script's comment section.
Please do not ask about access to use scripts in the script's comment section.
免責事項
この情報および投稿は、TradingViewが提供または推奨する金融、投資、トレード、その他のアドバイスや推奨を意図するものではなく、それらを構成するものでもありません。詳細は利用規約をご覧ください。