INVITE-ONLY SCRIPT
更新済 MTF Market Structure Pivots/Dealing Ranges | InvrsROBINHOOD
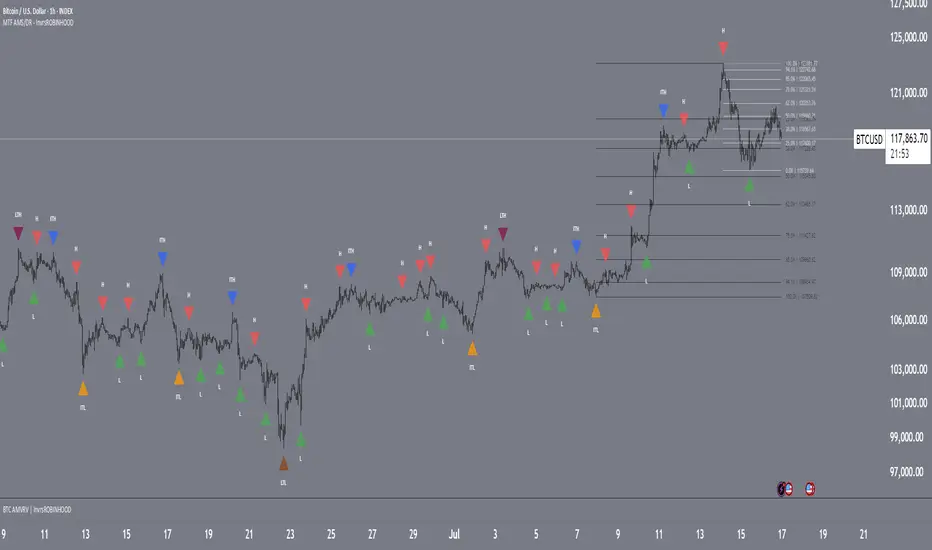
Multi-Timeframe Advanced Market Structure Pivots - Dealing Ranges | InvrsROBINHOOD
This indicator provides a sophisticated framework for analyzing market structure by identifying and classifying key pivot points on the user defined higher timeframes. It automatically draws the most relevant bullish and bearish dealing ranges based on this structure, equipping traders with a clear and objective view of the market's flow and potential areas of interest whilst on the lower timeframes.
Understanding Market Structure
At its core, market structure is the sequence of highs and lows that form the trend. This indicator demystifies market structure by categorizing pivots into a three-tiered hierarchy, allowing you to instantly gauge the significance of a swing point.
The Hierarchy of Pivots
Short Term Highs (H) & Lows (L)
These are the most basic swing points in price action, representing minor, localized turning points. They are the fundamental building blocks of all larger trends and structures. While common, they help define the immediate price action and short-term directional bias.
Intermediate Highs (ITH) & Lows (ITL)
An Intermediate High (ITH) is a short-term high that is higher than the short-term highs immediately preceding and succeeding it. Similarly, an Intermediate Low (ITL) is a short-term low that is lower than its neighboring lows.
Importance: These pivots are significantly more important than standard H/L points. They represent a more substantial shift in supply and demand and often mark the beginning or end of a corrective wave within a larger trend. A break of an ITH or ITL suggests a potential change in the intermediate-term trend.
Long Term Highs (LTH) & Lows (LTL)
These are the most critical pivots identified by the indicator. A Long Term High (LTH) is an intermediate high that is higher than the intermediate highs on either side of it. A Long Term Low (LTL) is an intermediate low that is lower than its neighboring intermediate lows.
Importance: LTH and LTL points represent major structural anchors. They often define the boundaries of long-term trading ranges, mark the conclusion of major market cycles, or signal a significant trend reversal. A price break beyond an LTH or LTL is a powerful confirmation that the long-term market structure has shifted.
By understanding this hierarchy, a trader can better assess the strength of a trend. For example, in a strong uptrend, price will consistently form higher L's, IPL's, and LTL's. A break of a key ITL would be the first major warning sign that the dominant bullish structure is in jeopardy.
The Dealing Range: Fibonacci Analysis
Beyond identifying pivots, the indicator's primary function is to establish the current Dealing Range. A dealing range is the price zone between a significant structural pivot and the subsequent impulse move away from it. The indicator uses a proprietary scoring system to objectively identify the most probable and "protected" high or low to anchor these ranges.
How to Use the Dealing Ranges
The indicator will plot two potential dealing ranges, one bullish and one bearish, complete with key Fibonacci retracement levels.
Bullish Dealing Range (Black):
This range is drawn from a significant low (the anchor) up to the highest high formed after that low.
Application: This range highlights potential "discount" buying opportunities. When price pulls back from the high, the Fibonacci levels (e.g., 50%, 61.8%, 78.6%) serve as high-probability zones where buyers may step in to resume the upward trend. The original low of the range is the ultimate invalidation point for this bullish idea.
Invalidation: The bullish range is considered complete and will be removed if the price breaks above the high of the range, as the market has shown its intention to continue higher. The indicator will then seek to establish a new range.
Bearish Dealing Range (White):
This range is drawn from a significant high (the anchor) down to the lowest low formed after that high.
Application: This range identifies potential "premium" selling opportunities. As price rallies from the low, the Fibonacci levels act as potential resistance zones where sellers may re-emerge to continue the downward trend. The original high of the range is the ultimate invalidation for this bearish scenario.
Invalidation: The bearish range is considered complete and will be removed if the price breaks below the low of the range, signaling a continuation of the downtrend. The indicator will then await a new structure to form.
By combining a hierarchical understanding of market structure with automatically drawn Fibonacci dealing ranges, this tool helps traders to objectively identify the trend, frame high-probability trade ideas, and manage risk with clearly defined levels of interest and invalidation.
リリースノート
• Fixed invalidation bug for the dealing range drawings.• Fixed label placement for DR's
リリースノート
• Fixed DR Calculations to now use the highest scored anchor point to the most recent highest high (Bullish), or Lowest Low (Bearish). リリースノート
• Fixed bearish dealing range anchor points. 招待専用スクリプト
このスクリプトは作者が承認したユーザーのみアクセス可能です。使用するにはアクセス申請をして許可を得る必要があります。通常は支払い後に承認されます。詳細は下記の作者の指示に従うか、InvrsROBINHOODに直接お問い合わせください。
TradingViewは、作者を完全に信頼し、スクリプトの動作を理解していない限り、有料スクリプトの購入・使用を推奨しません。コミュニティスクリプトには無料のオープンソースの代替が多数あります。
作者の指示
To gain access to this indicator, you can find it here:
https://whop.com/invrsrobinhood/
免責事項
この情報および投稿は、TradingViewが提供または推奨する金融、投資、トレード、その他のアドバイスや推奨を意図するものではなく、それらを構成するものでもありません。詳細は利用規約をご覧ください。
招待専用スクリプト
このスクリプトは作者が承認したユーザーのみアクセス可能です。使用するにはアクセス申請をして許可を得る必要があります。通常は支払い後に承認されます。詳細は下記の作者の指示に従うか、InvrsROBINHOODに直接お問い合わせください。
TradingViewは、作者を完全に信頼し、スクリプトの動作を理解していない限り、有料スクリプトの購入・使用を推奨しません。コミュニティスクリプトには無料のオープンソースの代替が多数あります。
作者の指示
To gain access to this indicator, you can find it here:
https://whop.com/invrsrobinhood/
免責事項
この情報および投稿は、TradingViewが提供または推奨する金融、投資、トレード、その他のアドバイスや推奨を意図するものではなく、それらを構成するものでもありません。詳細は利用規約をご覧ください。