PROTECTED SOURCE SCRIPT
更新済 ICT Suspension Block [tncylyv]
ICT Suspension Block [tncylyv]
Overview
This indicator identifies and highlights the "ICT Suspension Block," a specific three-candle pattern that signifies a potential area of support or resistance. It is designed to find temporary pauses or "suspensions" in price delivery, creating zones where the market may later return.
This tool is highly customizable, allowing you to focus on specific market conditions, sessions, and biases.
What is an ICT Suspension Block?
The Suspension Block is a nuanced 3-bar pattern that captures a very specific type of price action imbalance. Unlike a standard Fair Value Gap (FVG), it does not require a literal price gap. Instead, it's defined by the relationship between the opens and closes of three consecutive candles, all moving in the same direction.
• Bullish Suspension Block (+ SB) Conditions:
1. All three candles in the pattern must be bullish (close > open).
2. The close of the first candle must be below the open of the second candle.
3. The close of the second candle must be below the open of the third candle.
The resulting zone is drawn from the close of the first candle to the open of the third candle.
• Bearish Suspension Block (- SB) Conditions:
1. All three candles in the pattern must be bearish (close < open).
2. The close of the first candle must be above the open of the second candle.
3. The close of the second candle must be above the open of the third candle.
The resulting zone is drawn from the close of the first candle to the open of the third candle.
How to Use It
Suspension Blocks can be powerful tools when integrated into a broader trading strategy. They represent areas where price moved aggressively, leaving behind an inefficiently traded zone that the market may need to revisit.
• Potential Support & Resistance: A Bullish Suspension Block can act as a potential support level on a retest. Conversely, a Bearish Suspension Block can act as potential resistance.
• Entry Confluence: Look for price to retrace into a previously formed Suspension Block. The zone can provide a high-probability area to look for entries, especially when combined with other confluences like order blocks, breaker blocks, or higher timeframe market structure.
• Context is Key: The validity of a Suspension Block often depends on the market context. A block formed during a strong, impulsive move is typically more significant than one formed during choppy, consolidative price action.
Features & Settings
This indicator is designed to be flexible and adapt to your specific trading style.
• Show Blocks:
o Both: Display both Bullish and Bearish blocks.
o Bullish Only: Focus exclusively on potential support zones. Ideal for an uptrending market or when you have a bullish bias.
o Bearish Only: Focus exclusively on potential resistance zones. Ideal for a downtrending market or when you have a bearish bias.
• Max # of Blocks to Show:
o Avoid chart clutter by only displaying the most recent N blocks. This ensures you are always focused on the latest and most relevant zones.
• Time Filter (RTH Session):
o Enable Only Detect Inside RTH? to filter out patterns that form in low-volume, after-hours sessions. This helps ensure the zones you see were created during periods of significant market participation.
o The RTH session times and timezone are fully customizable.
• Customization:
o Adjust the colors for Bullish and Bearish blocks to match your chart's theme.
o Modify the text size of the + SB and - SB labels for better visibility.
________________________________________
Disclaimer: This indicator is a tool for market analysis and should not be used as a standalone trading signal. Always use proper risk management and combine this tool with your own comprehensive trading strategy. Past performance is not indicative of future results.
リリースノート
+Added optional C.E. level+Added text color input
リリースノート
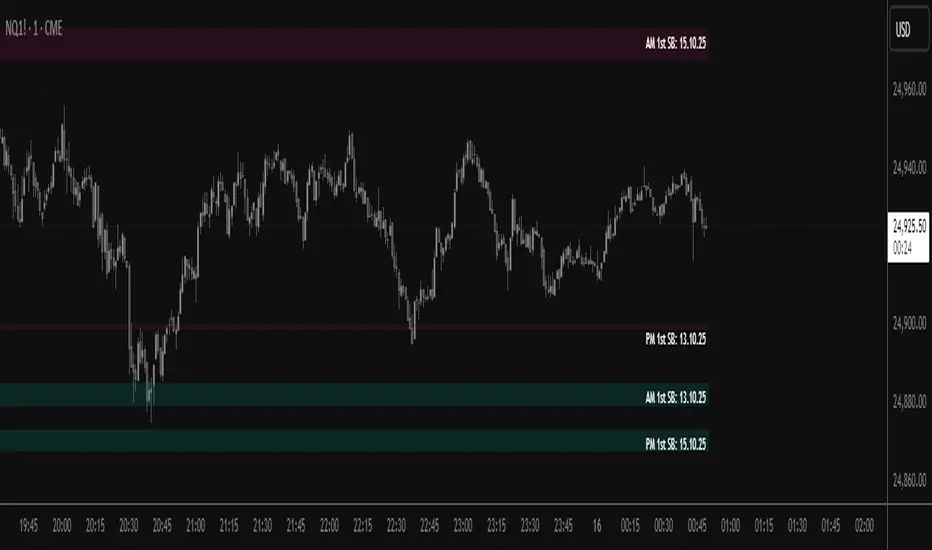
/ Added first presented Suspension Block logic. It now detects first Suspension Block that created during 9:30-10:00 for AM and 13:30-14:00 for PM. 保護スクリプト
このスクリプトのソースコードは非公開で投稿されています。 ただし、制限なく自由に使用できます – 詳細はこちらでご確認ください。
免責事項
この情報および投稿は、TradingViewが提供または推奨する金融、投資、トレード、その他のアドバイスや推奨を意図するものではなく、それらを構成するものでもありません。詳細は利用規約をご覧ください。
免責事項
この情報および投稿は、TradingViewが提供または推奨する金融、投資、トレード、その他のアドバイスや推奨を意図するものではなく、それらを構成するものでもありません。詳細は利用規約をご覧ください。