INVITE-ONLY SCRIPT
-=Simplicity=- God Complex
Making money is simple when you wield untold power
-=Simplicity=- God Complex is a non-repaint, set-and-forget indicator for identifying optimum times to enter and exit the market, with both longs and shorts.
Applicable to any asset-type, market, candle type and timeframe, God Complex is a quintessential tool for both new and veteran traders.
With only one variable to change it will take a minimal amount of time to find a value that suits you. As a rule of thumb, the higher the value the less it will fire signals, but the safer those signals will be.
You can also opt to only enable 'Long' or 'Short' signals on the chart. This is meaningful when trading leverage or margin along trend that you are able to identify.
This can be used as a guide for manual trading, but is best utilized as a tool for automating trades so that you don't miss out on any market activity.
This is a link to a document elucidating a little more on the script: docs.google.com/document/d/109M94DAEI3Cq0b1Yvwh8R7YjwpWQGowj71Grsm3tL10/edit
---------------------
Here are a few charts showing how the script performs against them. Enjoy.
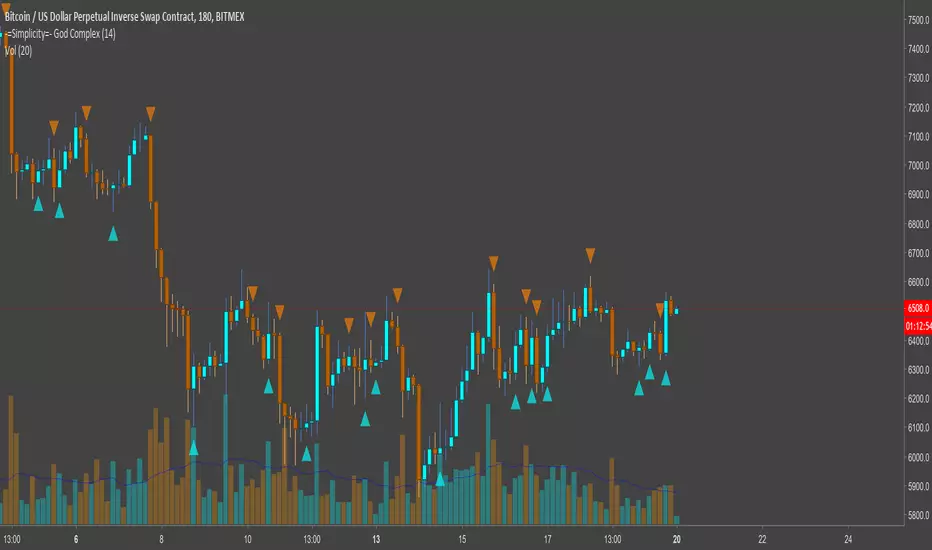
Below is a chart depicting XBTUSD (BitMEX) on a 30M timeframe. Both longs and shorts are enabled and the variable is set to a value of 144.

Below here we have a chart for BNBBTC (Binance) on a 1HR timeframe with variable set to a value of 14 on Heikin Ashi candles. Large orange arrows are shorts and smaller blue arrows are closing shorts. There's a clear downtrend, hence we're only shorting.

This is EOSBTC (Bitfinex) on a 2HR timeframe with a variable set to 7 on Renko charts. Small orange arrows are exiting a long position and large blue arrows are entering a long position. The uptrend is obvious to see, so that's why we're mainly displaying longs here.

Not that I reccommend anyone to trade such a small timeframe, but this is for all you scalpers out there. XBTUSD (BitMEX) on a 1M timeframe with a variable value of 233. Both longs and shorts are enabled for this chart. Normal bar candles apply.

Finally, this is ARKBTC (BitTrex) on a 2HR timeframe against a 500R chart with a variable of 377. Only shorts are enabled, as we're in a downtrend.

---------------------
Please contact overttherainbow on Telegram if you'd like to discuss anything, alternatively reach out to me here (although Telegram is better for a quick response; I'll be around 9AM-11PM GMT)
-=Simplicity=- God Complex is a non-repaint, set-and-forget indicator for identifying optimum times to enter and exit the market, with both longs and shorts.
Applicable to any asset-type, market, candle type and timeframe, God Complex is a quintessential tool for both new and veteran traders.
With only one variable to change it will take a minimal amount of time to find a value that suits you. As a rule of thumb, the higher the value the less it will fire signals, but the safer those signals will be.
You can also opt to only enable 'Long' or 'Short' signals on the chart. This is meaningful when trading leverage or margin along trend that you are able to identify.
This can be used as a guide for manual trading, but is best utilized as a tool for automating trades so that you don't miss out on any market activity.
This is a link to a document elucidating a little more on the script: docs.google.com/document/d/109M94DAEI3Cq0b1Yvwh8R7YjwpWQGowj71Grsm3tL10/edit
---------------------
Here are a few charts showing how the script performs against them. Enjoy.
Below is a chart depicting XBTUSD (BitMEX) on a 30M timeframe. Both longs and shorts are enabled and the variable is set to a value of 144.
Below here we have a chart for BNBBTC (Binance) on a 1HR timeframe with variable set to a value of 14 on Heikin Ashi candles. Large orange arrows are shorts and smaller blue arrows are closing shorts. There's a clear downtrend, hence we're only shorting.
This is EOSBTC (Bitfinex) on a 2HR timeframe with a variable set to 7 on Renko charts. Small orange arrows are exiting a long position and large blue arrows are entering a long position. The uptrend is obvious to see, so that's why we're mainly displaying longs here.
Not that I reccommend anyone to trade such a small timeframe, but this is for all you scalpers out there. XBTUSD (BitMEX) on a 1M timeframe with a variable value of 233. Both longs and shorts are enabled for this chart. Normal bar candles apply.
Finally, this is ARKBTC (BitTrex) on a 2HR timeframe against a 500R chart with a variable of 377. Only shorts are enabled, as we're in a downtrend.
---------------------
Please contact overttherainbow on Telegram if you'd like to discuss anything, alternatively reach out to me here (although Telegram is better for a quick response; I'll be around 9AM-11PM GMT)
招待専用スクリプト
このスクリプトは作者が承認したユーザーのみアクセス可能です。使用するにはアクセス申請をして許可を得る必要があります。通常は支払い後に承認されます。詳細は下記の作者の指示に従うか、overttherainbowに直接お問い合わせください。
TradingViewは、作者を完全に信頼し、スクリプトの動作を理解していない限り、有料スクリプトの購入・使用を推奨しません。コミュニティスクリプトには無料のオープンソースの代替が多数あります。
作者の指示
免責事項
この情報および投稿は、TradingViewが提供または推奨する金融、投資、トレード、その他のアドバイスや推奨を意図するものではなく、それらを構成するものでもありません。詳細は利用規約をご覧ください。