PROTECTED SOURCE SCRIPT
更新済 MeanReversion by Volatility
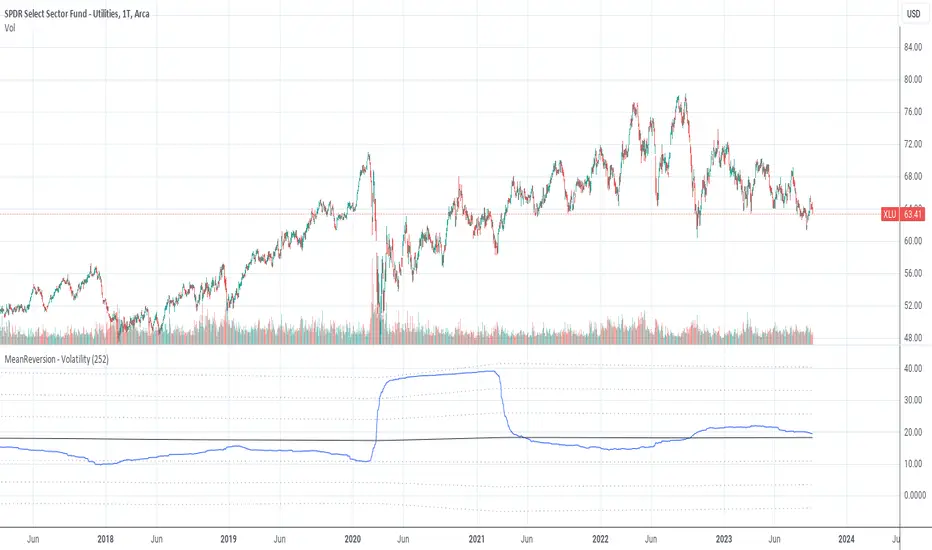
Mean reversion is a financial term for the assumption that an asset will return to its mean value.
This indicator calculate the volatility of an asset over a period of time and show the values of logRerturn, mean and standart deviations.
The default time period for volatility calculation is 252 bars at a "Daily" chart. At a "Daily" chart 252 bar means one trading-year.
See also:
MeanReversion by Logarithmic Returns
リリースノート
Fixed wrong textリリースノート
Fixed wrong textリリースノート
fixed color リリースノート
refactoringリリースノート
- removed plot offset for better visualization保護スクリプト
このスクリプトのソースコードは非公開で投稿されています。 ただし、制限なく自由に使用できます – 詳細はこちらでご確認ください。
免責事項
この情報および投稿は、TradingViewが提供または推奨する金融、投資、トレード、その他のアドバイスや推奨を意図するものではなく、それらを構成するものでもありません。詳細は利用規約をご覧ください。
免責事項
この情報および投稿は、TradingViewが提供または推奨する金融、投資、トレード、その他のアドバイスや推奨を意図するものではなく、それらを構成するものでもありません。詳細は利用規約をご覧ください。