PROTECTED SOURCE SCRIPT
更新済 Profitolio Swing Strategy V1.2
Profitolio Swing Strategy V1.2 - User Guide
Overview
The Profitolio Swing Strategy (PSS V1.2) is a comprehensive swing trading indicator designed to identify high-probability trade setups by combining multiple technical analysis methods. This indicator helps traders capture medium-term price movements while managing risk effectively.
What This Indicator Does
This indicator analyzes market momentum and volatility to generate clear BUY and SELL signals. It uses a confluence approach, meaning signals only appear when multiple conditions align, reducing false signals and improving trade quality.
Key Features
Visual Components
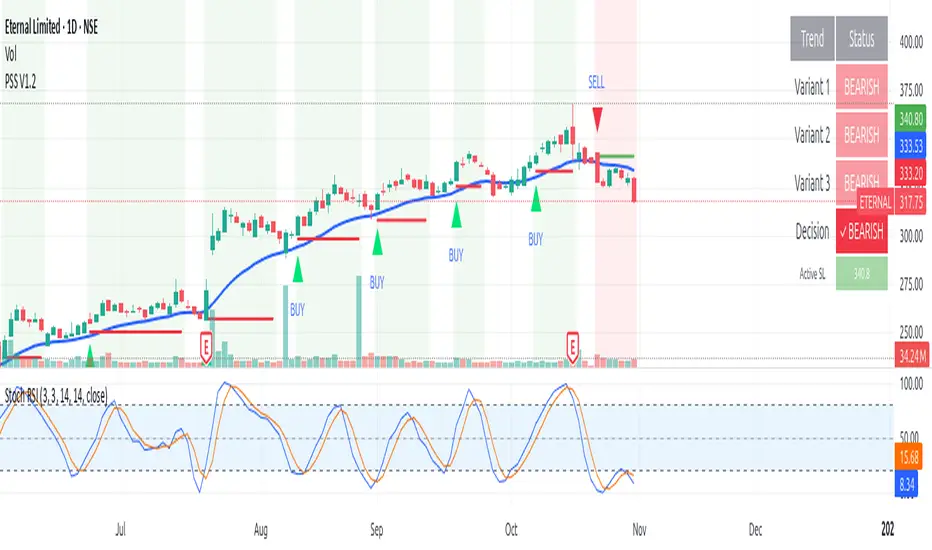
1. Signal Markers
Green Triangle (BUY): Appears below candles when bullish conditions align
Red Triangle (SELL): Appears above candles when bearish conditions align
2. Reference Lines
Blue Line: 21-period Exponential Moving Average (EMA) - shows medium-term trend direction
Orange Circles: Volume Weighted Average Price (VWAP) - represents fair value based on price and volume
3. Stoploss Management
Red Horizontal Line: Active stoploss for long positions (appears after BUY signal)
Green Horizontal Line: Active stoploss for short positions (appears after SELL signal)
"SL HIT!" Label: Appears when price touches the stoploss level
4. Background Color
Light Green: Indicates overall bullish market condition
Light Red: Indicates overall bearish market condition
No Color: Neutral/mixed conditions
5. Dashboard (Top Right)
Shows the status of multiple trend variants and the final decision:
Individual variant status (Variant 1, 2, 3)
Overall decision (BULLISH/BEARISH/NEUTRAL)
Active stoploss value
Parameters Used
ATR-Based Calculations
The indicator uses different Average True Range (ATR) and multipliers which measures market volatility
Lower multipliers: More sensitive, faster signals
Higher multipliers: Less sensitive, more stable signals
Moving Averages
21 EMA: Helps identify the prevailing trend direction. Price above EMA suggests uptrend, below suggests downtrend
VWAP: Acts as dynamic support/resistance. Institutional traders often use this as a reference point
How to Use This Indicator
Step 1: Wait for Signal Confirmation
Do not trade when background is absent (neutral condition)
Look for BUY signal when background turns light green
Look for SELL signal when background turns light red
Step 2: Entry Rules
For Long Positions (BUY):
Wait for green triangle below candle
Confirm price is above the 21 EMA (blue line) for stronger probability
Enter at current market price or next candle open
For Short Positions (SELL):
Wait for red triangle above candle
Confirm price is below the 21 EMA (blue line) for stronger probability
Enter at current market price or next candle open
Step 3: Risk Management
Stoploss Placement:
For BUY trades: The indicator automatically marks a stoploss level (red line) based on recent price action
For SELL trades: The indicator automatically marks a stoploss level (green line) based on recent price action
These levels persist until hit or trend reverses
Exit Strategies:
Stoploss Exit: Exit when price hits the marked stoploss line (you'll see "SL HIT!" label)
Signal Reversal: Exit when opposite signal appears
Background Change: Consider exiting when background color disappears (trend weakening)
Step 4: Additional Confirmation
Use EMA & VWAP for Confluence:
Stronger BUY: When price is above both EMA and VWAP
Stronger SELL: When price is below both EMA and VWAP
Caution: When price is between EMA and VWAP (mixed signals)
Best Practices
✅ DO:
Use on higher timeframes (4H, Daily) for swing trading
Wait for clear signal confirmation
Respect the stoploss levels
Check dashboard for overall market condition
Use on trending markets for best results
❌ DON'T:
Trade during neutral/gray periods
Ignore stoploss levels
Trade against the background color
Use on very short timeframes (1min, 5min) - designed for swing trading
Enter trades when all three variants show mixed signals
Alert Setup
The indicator includes built-in alerts:
"All Bullish": Triggered on BUY signal
"All Bearish": Triggered on SELL signal
"Buy SL Hit": When long stoploss is touched
"Sell SL Hit": When short stoploss is touched
Timeframe Recommendations
Best: Daily, 4-Hour charts
Good: 1-Hour charts
Not Recommended: Below 1-Hour (too many false signals)
Understanding the Dashboard
The dashboard shows a breakdown of the decision-making process:
Variant 1, 2, 3: Individual component analysis
Decision: Final verdict (requires all variants to agree)
Active SL: Current stoploss level for open position
Risk Disclaimer
This indicator is a tool to assist in trading decisions. Always:
Use proper position sizing
Never risk more than 1-2% per trade
Combine with your own analysis
Practice on paper/demo accounts first
Past performance doesn't guarantee future results
Note: This indicator works best in trending markets and may generate fewer signals in ranging/choppy conditions. Patience is key to successful swing trading.
Overview
The Profitolio Swing Strategy (PSS V1.2) is a comprehensive swing trading indicator designed to identify high-probability trade setups by combining multiple technical analysis methods. This indicator helps traders capture medium-term price movements while managing risk effectively.
What This Indicator Does
This indicator analyzes market momentum and volatility to generate clear BUY and SELL signals. It uses a confluence approach, meaning signals only appear when multiple conditions align, reducing false signals and improving trade quality.
Key Features
Visual Components
1. Signal Markers
Green Triangle (BUY): Appears below candles when bullish conditions align
Red Triangle (SELL): Appears above candles when bearish conditions align
2. Reference Lines
Blue Line: 21-period Exponential Moving Average (EMA) - shows medium-term trend direction
Orange Circles: Volume Weighted Average Price (VWAP) - represents fair value based on price and volume
3. Stoploss Management
Red Horizontal Line: Active stoploss for long positions (appears after BUY signal)
Green Horizontal Line: Active stoploss for short positions (appears after SELL signal)
"SL HIT!" Label: Appears when price touches the stoploss level
4. Background Color
Light Green: Indicates overall bullish market condition
Light Red: Indicates overall bearish market condition
No Color: Neutral/mixed conditions
5. Dashboard (Top Right)
Shows the status of multiple trend variants and the final decision:
Individual variant status (Variant 1, 2, 3)
Overall decision (BULLISH/BEARISH/NEUTRAL)
Active stoploss value
Parameters Used
ATR-Based Calculations
The indicator uses different Average True Range (ATR) and multipliers which measures market volatility
Lower multipliers: More sensitive, faster signals
Higher multipliers: Less sensitive, more stable signals
Moving Averages
21 EMA: Helps identify the prevailing trend direction. Price above EMA suggests uptrend, below suggests downtrend
VWAP: Acts as dynamic support/resistance. Institutional traders often use this as a reference point
How to Use This Indicator
Step 1: Wait for Signal Confirmation
Do not trade when background is absent (neutral condition)
Look for BUY signal when background turns light green
Look for SELL signal when background turns light red
Step 2: Entry Rules
For Long Positions (BUY):
Wait for green triangle below candle
Confirm price is above the 21 EMA (blue line) for stronger probability
Enter at current market price or next candle open
For Short Positions (SELL):
Wait for red triangle above candle
Confirm price is below the 21 EMA (blue line) for stronger probability
Enter at current market price or next candle open
Step 3: Risk Management
Stoploss Placement:
For BUY trades: The indicator automatically marks a stoploss level (red line) based on recent price action
For SELL trades: The indicator automatically marks a stoploss level (green line) based on recent price action
These levels persist until hit or trend reverses
Exit Strategies:
Stoploss Exit: Exit when price hits the marked stoploss line (you'll see "SL HIT!" label)
Signal Reversal: Exit when opposite signal appears
Background Change: Consider exiting when background color disappears (trend weakening)
Step 4: Additional Confirmation
Use EMA & VWAP for Confluence:
Stronger BUY: When price is above both EMA and VWAP
Stronger SELL: When price is below both EMA and VWAP
Caution: When price is between EMA and VWAP (mixed signals)
Best Practices
✅ DO:
Use on higher timeframes (4H, Daily) for swing trading
Wait for clear signal confirmation
Respect the stoploss levels
Check dashboard for overall market condition
Use on trending markets for best results
❌ DON'T:
Trade during neutral/gray periods
Ignore stoploss levels
Trade against the background color
Use on very short timeframes (1min, 5min) - designed for swing trading
Enter trades when all three variants show mixed signals
Alert Setup
The indicator includes built-in alerts:
"All Bullish": Triggered on BUY signal
"All Bearish": Triggered on SELL signal
"Buy SL Hit": When long stoploss is touched
"Sell SL Hit": When short stoploss is touched
Timeframe Recommendations
Best: Daily, 4-Hour charts
Good: 1-Hour charts
Not Recommended: Below 1-Hour (too many false signals)
Understanding the Dashboard
The dashboard shows a breakdown of the decision-making process:
Variant 1, 2, 3: Individual component analysis
Decision: Final verdict (requires all variants to agree)
Active SL: Current stoploss level for open position
Risk Disclaimer
This indicator is a tool to assist in trading decisions. Always:
Use proper position sizing
Never risk more than 1-2% per trade
Combine with your own analysis
Practice on paper/demo accounts first
Past performance doesn't guarantee future results
Note: This indicator works best in trending markets and may generate fewer signals in ranging/choppy conditions. Patience is key to successful swing trading.
リリースノート
Profitolio Swing Strategy V1.2 - User GuideOverview
The Profitolio Swing Strategy (PSS V1.2) is a comprehensive swing trading indicator designed to identify high-probability trade setups by combining multiple technical analysis methods. This indicator helps traders capture medium-term price movements while managing risk effectively.
What This Indicator Does
This indicator analyzes market momentum and volatility to generate clear BUY and SELL signals. It uses a confluence approach, meaning signals only appear when multiple conditions align, reducing false signals and improving trade quality.
Key Features
Visual Components
1. Signal Markers
Green Triangle (BUY): Appears below candles when bullish conditions align
Red Triangle (SELL): Appears above candles when bearish conditions align
2. Reference Lines
Blue Line: 21-period Exponential Moving Average (EMA) - shows medium-term trend direction
Orange Circles: Volume Weighted Average Price (VWAP) - represents fair value based on price and volume
3. Stoploss Management
Red Horizontal Line: Active stoploss for long positions (appears after BUY signal)
Green Horizontal Line: Active stoploss for short positions (appears after SELL signal)
"SL HIT!" Label: Appears when price touches the stoploss level
4. Background Color
Light Green: Indicates overall bullish market condition
Light Red: Indicates overall bearish market condition
No Color: Neutral/mixed conditions
5. Dashboard (Top Right)
Shows the status of multiple trend variants and the final decision:
Individual variant status (Variant 1, 2, 3)
Overall decision (BULLISH/BEARISH/NEUTRAL)
Active stoploss value
Parameters Used
ATR-Based Calculations
The indicator uses different Average True Range (ATR) and multipliers which measures market volatility
Lower multipliers: More sensitive, faster signals
Higher multipliers: Less sensitive, more stable signals
Moving Averages
21 EMA: Helps identify the prevailing trend direction. Price above EMA suggests uptrend, below suggests downtrend
VWAP: Acts as dynamic support/resistance. Institutional traders often use this as a reference point
How to Use This Indicator
Step 1: Wait for Signal Confirmation
Do not trade when background is absent (neutral condition)
Look for BUY signal when background turns light green
Look for SELL signal when background turns light red
Step 2: Entry Rules
For Long Positions (BUY):
Wait for green triangle below candle
Confirm price is above the 21 EMA (blue line) for stronger probability
Enter at current market price or next candle open
For Short Positions (SELL):
Wait for red triangle above candle
Confirm price is below the 21 EMA (blue line) for stronger probability
Enter at current market price or next candle open
Step 3: Risk Management
Stoploss Placement:
For BUY trades: The indicator automatically marks a stoploss level (red line) based on recent price action
For SELL trades: The indicator automatically marks a stoploss level (green line) based on recent price action
These levels persist until hit or trend reverses
Exit Strategies:
Stoploss Exit: Exit when price hits the marked stoploss line (you'll see "SL HIT!" label)
Signal Reversal: Exit when opposite signal appears
Background Change: Consider exiting when background color disappears (trend weakening)
Step 4: Additional Confirmation
Use EMA & VWAP for Confluence:
Stronger BUY: When price is above both EMA and VWAP
Stronger SELL: When price is below both EMA and VWAP
Caution: When price is between EMA and VWAP (mixed signals)
Best Practices
✅ DO:
Use on higher timeframes (4H, Daily) for swing trading
Wait for clear signal confirmation
Respect the stoploss levels
Check dashboard for overall market condition
Use on trending markets for best results
❌ DON'T:
Trade during neutral/gray periods
Ignore stoploss levels
Trade against the background color
Use on very short timeframes (1min, 5min) - designed for swing trading
Enter trades when all three variants show mixed signals
Alert Setup
The indicator includes built-in alerts:
"All Bullish": Triggered on BUY signal
"All Bearish": Triggered on SELL signal
"Buy SL Hit": When long stoploss is touched
"Sell SL Hit": When short stoploss is touched
Timeframe Recommendations
Best: Daily, 4-Hour charts
Good: 1-Hour charts
Not Recommended: Below 1-Hour (too many false signals)
Understanding the Dashboard
The dashboard shows a breakdown of the decision-making process:
Variant 1, 2, 3: Individual component analysis
Decision: Final verdict (requires all variants to agree)
Active SL: Current stoploss level for open position
Risk Disclaimer
This indicator is a tool to assist in trading decisions. Always:
Use proper position sizing
Never risk more than 1-2% per trade
Combine with your own analysis
Practice on paper/demo accounts first
Past performance doesn't guarantee future results
Note: This indicator works best in trending markets and may generate fewer signals in ranging/choppy conditions. Patience is key to successful swing trading.
保護スクリプト
このスクリプトのソースコードは非公開で投稿されています。 ただし、制限なく自由に使用できます – 詳細はこちらでご確認ください。
免責事項
この情報および投稿は、TradingViewが提供または推奨する金融、投資、トレード、その他のアドバイスや推奨を意図するものではなく、それらを構成するものでもありません。詳細は利用規約をご覧ください。
保護スクリプト
このスクリプトのソースコードは非公開で投稿されています。 ただし、制限なく自由に使用できます – 詳細はこちらでご確認ください。
免責事項
この情報および投稿は、TradingViewが提供または推奨する金融、投資、トレード、その他のアドバイスや推奨を意図するものではなく、それらを構成するものでもありません。詳細は利用規約をご覧ください。