PROTECTED SOURCE SCRIPT
更新済 Chessboard Support & Resistance
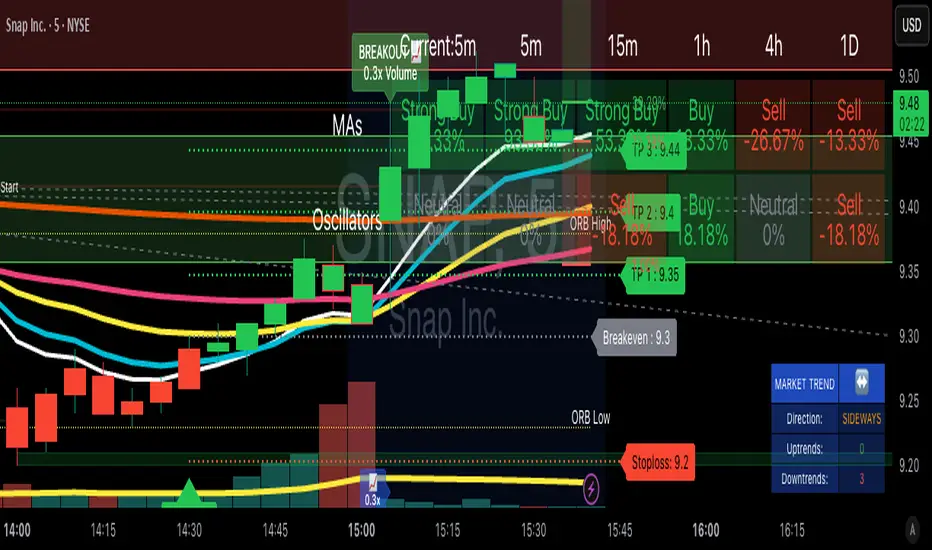
The “Chessboard Support & Resistance” indicator is designed to assist traders in visualizing key levels of support and resistance on a chart by employing ATR (Average True Range) to create dynamic horizontal zones. This indicator automatically plots robust support and resistance bands that can help identify potential areas where price may reverse, consolidate, or react. These levels are particularly beneficial for traders who employ concepts like Smart Money analysis, as they illustrate zones where institutional trading activity might occur.
How It Works:
• The indicator uses ATR-based calculations to determine the placement of the support and resistance zones. This approach accounts for market volatility, making the zones adaptive to changing conditions.
• The Zone Thickness parameter allows users to customize the width of the plotted zones, enhancing visibility and fitting them to their specific trading style.
• The support and resistance zones extend horizontally across the chart, providing clear reference points for potential price reactions.
Practical Application:
• Trend Analysis: Identify areas of significant price resistance and support to understand potential turning points or trends in the market.
• Risk Management: Use these zones to better inform stop-loss placements or set profit targets.
• Confirmation Tool: Combine the indicator with other technical analysis tools for confirmation of potential trade entries or exits.
Customization Options:
• Change the colors of the support and resistance zones for better integration with different chart themes.
• Adjust the ATR Length and Multiplier to fine-tune the sensitivity of the zones based on personal preferences and the characteristics of the asset being analyzed.
Disclaimer:
This indicator is for educational and informational purposes only. It is not intended to serve as investment advice or a recommendation to buy or sell any financial instrument. Always perform your own research and consider consulting with a financial professional before making trading decisions. Trading involves significant risk, and past performance does not guarantee future results.
リリースノート
The “RED-E Support & Resistance” indicator is designed to assist traders in visualizing key levels of support and resistance on a chart by employing ATR (Average True Range) to create dynamic horizontal zones. This indicator automatically plots robust support and resistance bands that can help identify potential areas where price may reverse, consolidate, or react. These levels are particularly beneficial for traders who employ concepts like Smart Money analysis, as they illustrate zones where institutional trading activity might occur.How It Works:
• The indicator uses ATR-based calculations to determine the placement of the support and resistance zones. This approach accounts for market volatility, making the zones adaptive to changing conditions.
• The Zone Thickness parameter allows users to customize the width of the plotted zones, enhancing visibility and fitting them to their specific trading style.
• The support and resistance zones extend horizontally across the chart, providing clear reference points for potential price reactions.
Practical Application:
• Trend Analysis: Identify areas of significant price resistance and support to understand potential turning points or trends in the market.
• Risk Management: Use these zones to better inform stop-loss placements or set profit targets.
• Confirmation Tool: Combine the indicator with other technical analysis tools for confirmation of potential trade entries or exits.
Customization Options:
• Change the colors of the support and resistance zones for better integration with different chart themes.
• Adjust the ATR Length and Multiplier to fine-tune the sensitivity of the zones based on personal preferences and the characteristics of the asset being analyzed.
Disclaimer:
This indicator is for educational and informational purposes only. It is not intended to serve as investment advice or a recommendation to buy or sell any financial instrument. Always perform your own research and consider consulting with a financial professional before making trading decisions. Trading involves significant risk, and past performance does not guarantee future results.
保護スクリプト
このスクリプトのソースコードは非公開で投稿されています。 ただし、制限なく自由に使用できます – 詳細はこちらでご確認ください。
MARK N. ROGERS, MBA
Rogers1906.com
Rogers1906.com
免責事項
この情報および投稿は、TradingViewが提供または推奨する金融、投資、トレード、その他のアドバイスや推奨を意図するものではなく、それらを構成するものでもありません。詳細は利用規約をご覧ください。
保護スクリプト
このスクリプトのソースコードは非公開で投稿されています。 ただし、制限なく自由に使用できます – 詳細はこちらでご確認ください。
MARK N. ROGERS, MBA
Rogers1906.com
Rogers1906.com
免責事項
この情報および投稿は、TradingViewが提供または推奨する金融、投資、トレード、その他のアドバイスや推奨を意図するものではなく、それらを構成するものでもありません。詳細は利用規約をご覧ください。