PROTECTED SOURCE SCRIPT
PpSigan ZigZag++
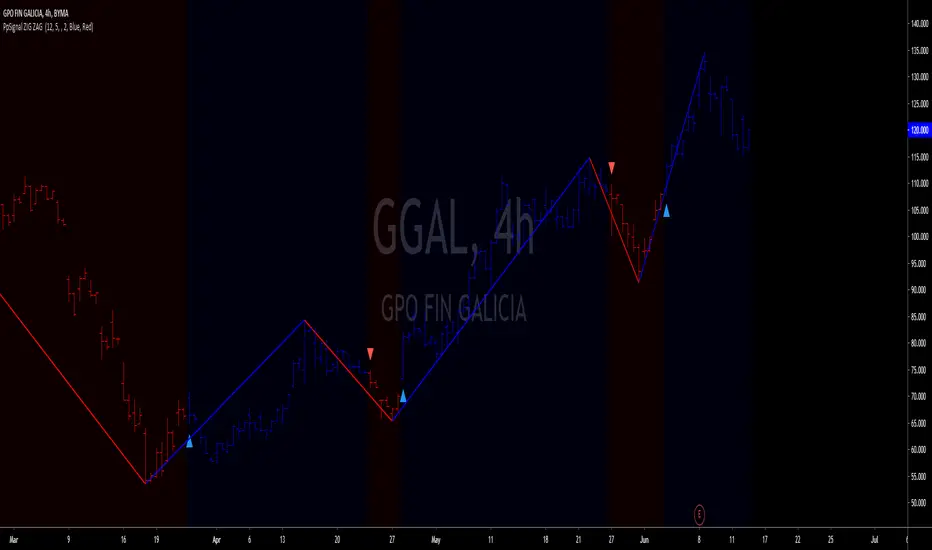
The Zig Zag indicator plots points on the chart whenever prices reverse by a percentage greater than a pre-chosen variable. Straight lines are then drawn, connecting these points. The indicator is used to help identify price trends. It eliminates random price fluctuations and attempts to show trend changes. Zig Zag lines only appear when there is a price movement between a swing high and a swing low that is greater than a specified percentage; often 5%. By filtering minor price movements, the indicator makes trends easier to spot in all time frames.
Buy when the price is blue or green choose your favorite up color and arrow is up.
sell when the price is red or orange choose your favorite up color and arrow is up.
Buy when the price is blue or green choose your favorite up color and arrow is up.
sell when the price is red or orange choose your favorite up color and arrow is up.
保護スクリプト
このスクリプトのソースコードは非公開で投稿されています。 ただし、制限なく自由に使用できます – 詳細はこちらでご確認ください。
免責事項
この情報および投稿は、TradingViewが提供または推奨する金融、投資、トレード、その他のアドバイスや推奨を意図するものではなく、それらを構成するものでもありません。詳細は利用規約をご覧ください。
保護スクリプト
このスクリプトのソースコードは非公開で投稿されています。 ただし、制限なく自由に使用できます – 詳細はこちらでご確認ください。
免責事項
この情報および投稿は、TradingViewが提供または推奨する金融、投資、トレード、その他のアドバイスや推奨を意図するものではなく、それらを構成するものでもありません。詳細は利用規約をご覧ください。