OPEN-SOURCE SCRIPT
APEX - ADX/ADXR/DI+/DI- [v1]
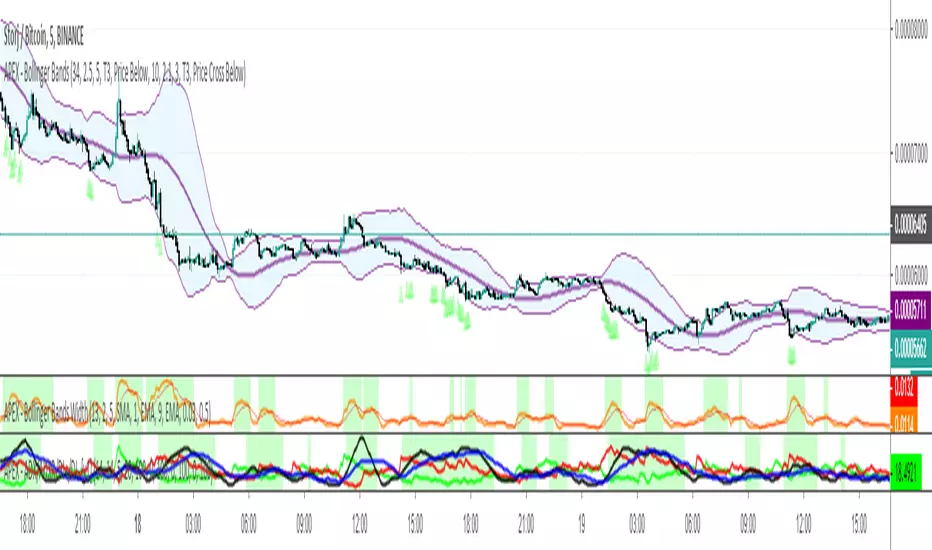
Average Directional Movement Index – ADX can be used to help measure the overall strength of a trend. The ADX indicator is an average of expanding price range values. The ADX is a component of the Directional Movement System developed by Welles Wilder. This indicator on its own does not give you a direction but instead measure the strength of the trend. In general values above 20 are considered a trending environment above 30 is then a strong trend and above 50 is a very strong trend.
Average Directional Movement Rating is based on the momentum change of the ADX itself. It is calculated by adding two ADX values (the current value and a value n periods back), then dividing by two. This additional smoothing makes than the ADXR slightly less responsive than ADX but helps to avoid noise.
Minus Directional Indicator (-DI) measures the presence of a downtrend and is part of the Average Directional Index (ADX). If -DI is sloping upward, it's a sign that the price downtrend is getting stronger. The Positive Directional Indicator (+DI) is a component of the Average Directional Index (ADX) and is used to measure the presence of an uptrend. When the +DI is sloping upward, it is a signal that the uptrend is getting stronger. In general values above 20 are considered a trending environment above 30 is then a strong trend and above 50 is a very strong trend.
オープンソーススクリプト
TradingViewの精神に則り、このスクリプトの作者はコードをオープンソースとして公開してくれました。トレーダーが内容を確認・検証できるようにという配慮です。作者に拍手を送りましょう!無料で利用できますが、コードの再公開はハウスルールに従う必要があります。
免責事項
この情報および投稿は、TradingViewが提供または推奨する金融、投資、トレード、その他のアドバイスや推奨を意図するものではなく、それらを構成するものでもありません。詳細は利用規約をご覧ください。
オープンソーススクリプト
TradingViewの精神に則り、このスクリプトの作者はコードをオープンソースとして公開してくれました。トレーダーが内容を確認・検証できるようにという配慮です。作者に拍手を送りましょう!無料で利用できますが、コードの再公開はハウスルールに従う必要があります。
免責事項
この情報および投稿は、TradingViewが提供または推奨する金融、投資、トレード、その他のアドバイスや推奨を意図するものではなく、それらを構成するものでもありません。詳細は利用規約をご覧ください。