PROTECTED SOURCE SCRIPT
Turning Point Indicator
Introduction
This is a powerful technical analysis indicator designed to detect divergences between multiple technical indicators and price. It can monitor up to 10 different technical indicators simultaneously, helping traders identify potential price reversal signals. Key Features
Multi-Indicator Support: Simultaneously detect divergences across multiple indicators, including MACD, RSI, Stochastics, CCI, Momentum, OBV, VW-MACD, CMF, and MFI.
Dual Divergence Type: Supports both regular and hidden divergences.
Smart Filtering: Set a minimum number of divergences to filter out weak signals.
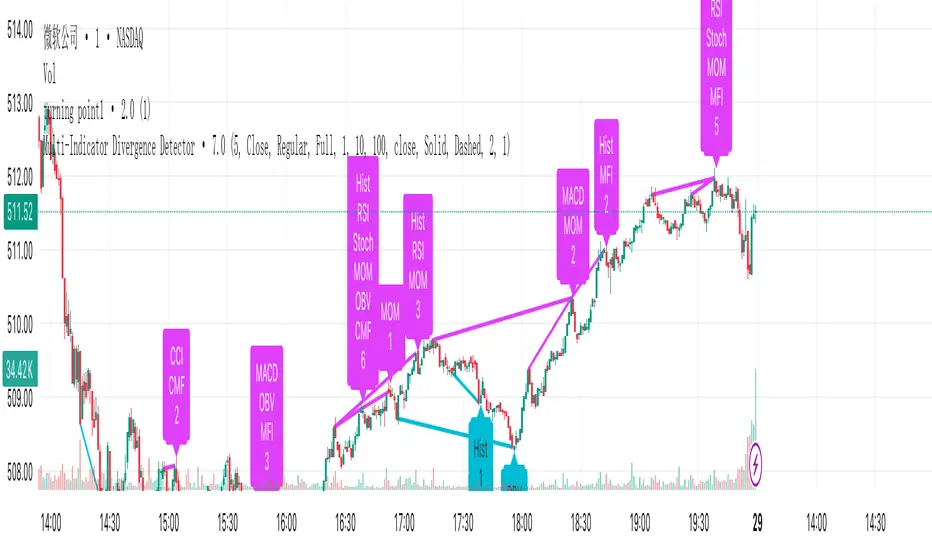
Visual Display: Clearly displays divergence locations and related indicators using connecting lines and labels.
Flexible Configuration: Supports a variety of display options and color customization.
Core Features: Divergence Detection
Regular Divergence: When prices reach new highs/lows but indicators haven't confirmed them, it signals a possible trend reversal.
Hidden Divergence: When prices pull back but indicators show a trend continuation, it signals a possible trend continuation.
How to Use:
Add Indicator: Apply the script to a chart.
Configure Parameters: Adjust parameters such as the pivot point period and the maximum number of candlesticks to detect as needed.
Select Indicator: Enable or disable divergence detection for specific technical indicators in the settings.
Watch Signal: Displays a signal on the chart when a sufficient number of divergences are detected. Connecting Lines and Labels
Parameter Description
Pivot Point Period: Defaults to 5, used to identify highs and lows
Minimum Divergences: Defaults to 1, sets the minimum number of divergences required to trigger a signal
Maximum Pivot Points: Defaults to 10, limits the detection range
Maximum Candlesticks Detected: Defaults to 100, controls the number of candlesticks detected forward
Signal Interpretation
Bottom Label (upward arrow): Positive divergence, a possible buy signal
Top Label (downward arrow): Negative divergence, a possible sell signal
Connecting Line Color:
Cyan: Positive regular divergence
Purple: Negative regular divergence
Green: Positive hidden divergence
Red: Negative hidden divergence
Usable Scenarios
Trend Reversal Point Identification
Entry and Exit Timing
Multi-Time Frame Analysis
Risk Management and Stop-Loss Setting
Notes
Divergence signals should be used in conjunction with other analysis methods.
It is recommended to use them on longer time frames for better accuracy.
Setting an appropriate minimum number of divergences can reduce false signals.
Indicator sensitivity may vary under different market conditions.
This is a powerful technical analysis indicator designed to detect divergences between multiple technical indicators and price. It can monitor up to 10 different technical indicators simultaneously, helping traders identify potential price reversal signals. Key Features
Multi-Indicator Support: Simultaneously detect divergences across multiple indicators, including MACD, RSI, Stochastics, CCI, Momentum, OBV, VW-MACD, CMF, and MFI.
Dual Divergence Type: Supports both regular and hidden divergences.
Smart Filtering: Set a minimum number of divergences to filter out weak signals.
Visual Display: Clearly displays divergence locations and related indicators using connecting lines and labels.
Flexible Configuration: Supports a variety of display options and color customization.
Core Features: Divergence Detection
Regular Divergence: When prices reach new highs/lows but indicators haven't confirmed them, it signals a possible trend reversal.
Hidden Divergence: When prices pull back but indicators show a trend continuation, it signals a possible trend continuation.
How to Use:
Add Indicator: Apply the script to a chart.
Configure Parameters: Adjust parameters such as the pivot point period and the maximum number of candlesticks to detect as needed.
Select Indicator: Enable or disable divergence detection for specific technical indicators in the settings.
Watch Signal: Displays a signal on the chart when a sufficient number of divergences are detected. Connecting Lines and Labels
Parameter Description
Pivot Point Period: Defaults to 5, used to identify highs and lows
Minimum Divergences: Defaults to 1, sets the minimum number of divergences required to trigger a signal
Maximum Pivot Points: Defaults to 10, limits the detection range
Maximum Candlesticks Detected: Defaults to 100, controls the number of candlesticks detected forward
Signal Interpretation
Bottom Label (upward arrow): Positive divergence, a possible buy signal
Top Label (downward arrow): Negative divergence, a possible sell signal
Connecting Line Color:
Cyan: Positive regular divergence
Purple: Negative regular divergence
Green: Positive hidden divergence
Red: Negative hidden divergence
Usable Scenarios
Trend Reversal Point Identification
Entry and Exit Timing
Multi-Time Frame Analysis
Risk Management and Stop-Loss Setting
Notes
Divergence signals should be used in conjunction with other analysis methods.
It is recommended to use them on longer time frames for better accuracy.
Setting an appropriate minimum number of divergences can reduce false signals.
Indicator sensitivity may vary under different market conditions.
保護スクリプト
このスクリプトのソースコードは非公開で投稿されています。 ただし、制限なく自由に使用できます – 詳細はこちらでご確認ください。
免責事項
この情報および投稿は、TradingViewが提供または推奨する金融、投資、トレード、その他のアドバイスや推奨を意図するものではなく、それらを構成するものでもありません。詳細は利用規約をご覧ください。
免責事項
この情報および投稿は、TradingViewが提供または推奨する金融、投資、トレード、その他のアドバイスや推奨を意図するものではなく、それらを構成するものでもありません。詳細は利用規約をご覧ください。