INVITE-ONLY SCRIPT
更新済 TM_DAY_TRACKER_SUPER
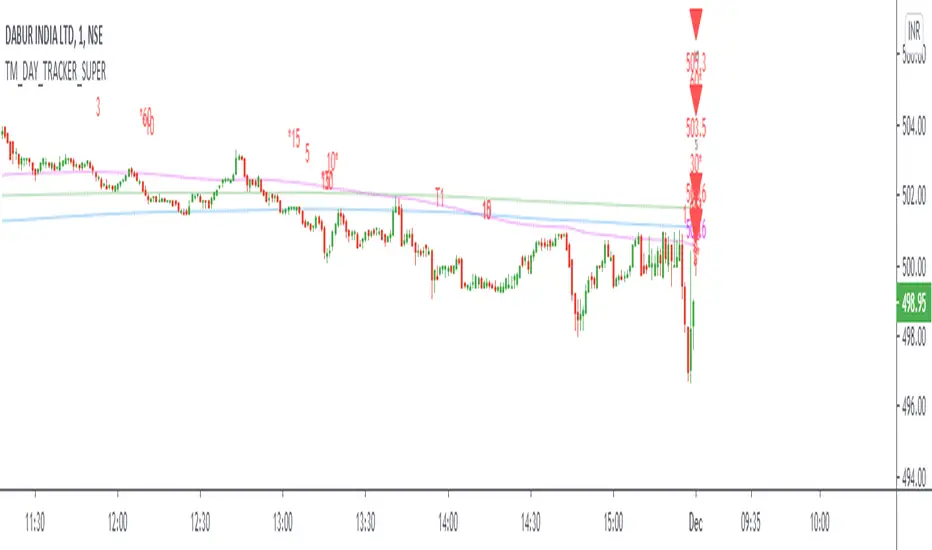
Day_Tracker_Super Indicator shows overall trend or market direction for Intraday / Swing Position along with Buy or sell signal.
Terminology Use ==> B- Buy, S- Sale Signal, and Numbers are to show time frame indication there is presence of buyer or seller like B1 for buy signal on 1 minute time frame etc.
Display and Interpretation ==> Buy Sale Signal in B/S , Digit with 1-3-5-10-15-30-60-D for different time frames, Value with Triangle mark shows possible direction of momentum
This indicator help to identify 4 major things:-
1. Area of order Buildup
2. Price Strength
3. Direction
4. Volatility
There are 3 Line in trend chart
Green for positive trend, red for negative trend
line change color based on trend change
least dark "Green/Red" shows main trend and work as major trend line". It describe which side market will take momentum and whenever price come to this area, very important for position build up either long side or short side"
light dark "Green/Red" work as primary support / resistance and area of value. During the price movement price takes support or resistance here and bounce back or reverse back"
most dark "blue/purple" work as volatility line . This is area of volatility and direction to main trend. Price crossing above or below will give huge direction movement
==> 2 line in common color "Green/Red" shows main trend
Use market structure, chart pattern, trend lines for more support..
There is 1 dot in chart, This dot show accumulation or distribution price, Green / Red line shows market strength. Signal with 1-3-5-10-15-30-60-D shows active order position over time frame and 1 with Price Value like show area of momentum or volatility . Signal on higher the time frame , more strong momentum
Time frame ==> Use proper Signal with swing trend on 1 minute, 3 minute 5 minute, 15 minute time frame
What to Identify ==> Overall Trend for the intraday and swing Period
How to Use ==>
See how and order buildup is seen and current order position. Also area for volatility and expected movement in price direction
Note: - Use market structure, chart pattern, trend lines and price action parameter for more confirmation.
Entry ==>
Let’s wait the proper area of support or resistance ( Area of Value in case of trend pattern use)
Exit ==>
SL of swing high/low out of market structure with proper risk management and target with proper Risk/ Reward Ratio
Use the Below Contacts to Access this Indicator
リリースノート
Update in Line Thicknessリリースノート
Update Closing Valueリリースノート
Update in Data Valueリリースノート
Updatesリリースノート
updatesリリースノート
updateリリースノート
Updatesリリースノート
Updateリリースノート
Updates招待専用スクリプト
このスクリプトは作者が承認したユーザーのみアクセス可能です。使用するにはアクセス申請をして許可を得る必要があります。通常は支払い後に承認されます。詳細は下記の作者の指示に従うか、TradingMind24に直接お問い合わせください。
TradingViewは、作者を完全に信頼し、スクリプトの動作を理解していない限り、有料スクリプトの購入・使用を推奨しません。コミュニティスクリプトには無料のオープンソースの代替が多数あります。
作者の指示
免責事項
この情報および投稿は、TradingViewが提供または推奨する金融、投資、トレード、その他のアドバイスや推奨を意図するものではなく、それらを構成するものでもありません。詳細は利用規約をご覧ください。
招待専用スクリプト
このスクリプトは作者が承認したユーザーのみアクセス可能です。使用するにはアクセス申請をして許可を得る必要があります。通常は支払い後に承認されます。詳細は下記の作者の指示に従うか、TradingMind24に直接お問い合わせください。
TradingViewは、作者を完全に信頼し、スクリプトの動作を理解していない限り、有料スクリプトの購入・使用を推奨しません。コミュニティスクリプトには無料のオープンソースの代替が多数あります。
作者の指示
免責事項
この情報および投稿は、TradingViewが提供または推奨する金融、投資、トレード、その他のアドバイスや推奨を意図するものではなく、それらを構成するものでもありません。詳細は利用規約をご覧ください。