OPEN-SOURCE SCRIPT
sadosi trends and barrier
This indicator should be used for give ideas.
what they can do?
how can?
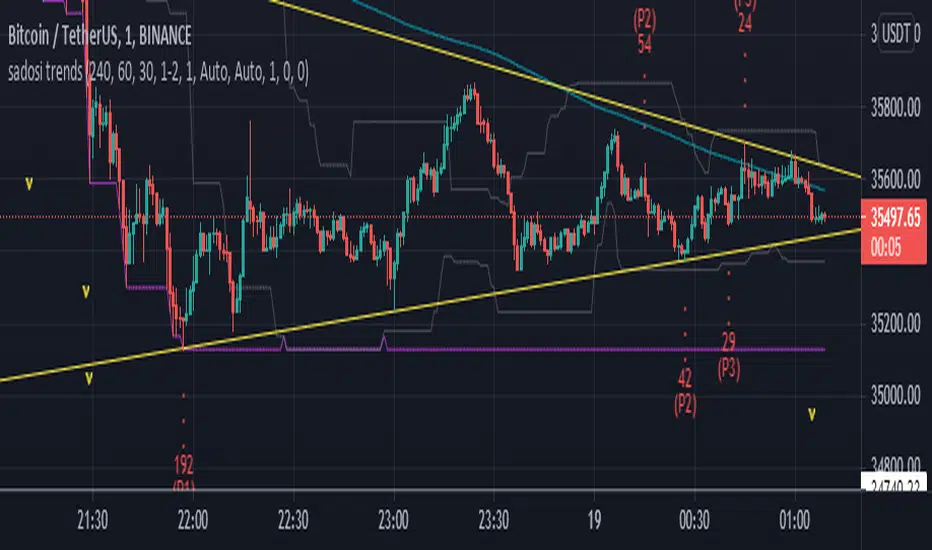
By analyzing the prices in the 3 selected periods, 3 highs and 3 lows prices are marked. With the marked points, trend and resistance lines are drawn. The current price is analyzed and useful calculations displayed in the info box. Finaly adding moving averages. After all these transactions, the trend and resistances become easily visible on the chart.
You can fine-tune the angle of the trend using high and low extensions
you can catch different trend lines by changing the high and low trend points
By changing the periods, you can set position the trend lines more accurately.
When the price is too low or too high, the information box will warn you by change color.
The trend lines to be created are for the purpose of giving an idea and convenience. It can be used on all timeframes, including horizontal trends.
what they can do?
- draw up and down trend lines
- draw support and resistance lines
- to inform about the current price
- signal for high and low prices
how can?
By analyzing the prices in the 3 selected periods, 3 highs and 3 lows prices are marked. With the marked points, trend and resistance lines are drawn. The current price is analyzed and useful calculations displayed in the info box. Finaly adding moving averages. After all these transactions, the trend and resistances become easily visible on the chart.
You can fine-tune the angle of the trend using high and low extensions
you can catch different trend lines by changing the high and low trend points
By changing the periods, you can set position the trend lines more accurately.
When the price is too low or too high, the information box will warn you by change color.
The trend lines to be created are for the purpose of giving an idea and convenience. It can be used on all timeframes, including horizontal trends.
オープンソーススクリプト
TradingViewの精神に則り、このスクリプトの作者はコードをオープンソースとして公開してくれました。トレーダーが内容を確認・検証できるようにという配慮です。作者に拍手を送りましょう!無料で利用できますが、コードの再公開はハウスルールに従う必要があります。
免責事項
この情報および投稿は、TradingViewが提供または推奨する金融、投資、トレード、その他のアドバイスや推奨を意図するものではなく、それらを構成するものでもありません。詳細は利用規約をご覧ください。
オープンソーススクリプト
TradingViewの精神に則り、このスクリプトの作者はコードをオープンソースとして公開してくれました。トレーダーが内容を確認・検証できるようにという配慮です。作者に拍手を送りましょう!無料で利用できますが、コードの再公開はハウスルールに従う必要があります。
免責事項
この情報および投稿は、TradingViewが提供または推奨する金融、投資、トレード、その他のアドバイスや推奨を意図するものではなく、それらを構成するものでもありません。詳細は利用規約をご覧ください。