OPEN-SOURCE SCRIPT
アップデート済 AlexD Market annual seasonality
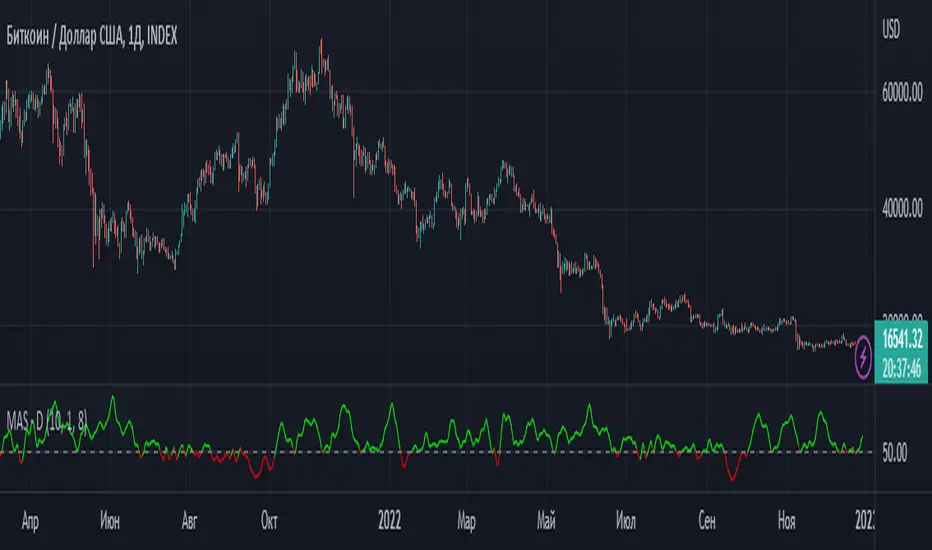
The indicator displays the percentage of bullish days with a given date over several years.
This allows you to determine the days of the year when the price usually goes up or down.
Indicator has a built-in "simple moving average" shifted back by half a period, due to which the delay of this smoothing is removed.
This allows you to determine the days of the year when the price usually goes up or down.
Indicator has a built-in "simple moving average" shifted back by half a period, due to which the delay of this smoothing is removed.
リリースノート
Offset removed from plot() functionリリースノート
Added smoothing when sampling the day of the year.The "Depth" property indicates how many bars to take for smoothing to the left and right of the found day.
Extreme bars are taken with less weighting for smooth signal decay.
I recommend setting "Depth" to 1. If you don't need to use this feature, set "Depth" to 0.
This is the final functionality change. Further changes are possible to optimize the indicator.
免責事項
これらの情報および投稿は、TradingViewが提供または保証する金融、投資、取引、またはその他の種類のアドバイスや推奨を意図したものではなく、またそのようなものでもありません。詳しくは利用規約をご覧ください。
免責事項
これらの情報および投稿は、TradingViewが提供または保証する金融、投資、取引、またはその他の種類のアドバイスや推奨を意図したものではなく、またそのようなものでもありません。詳しくは利用規約をご覧ください。