OPEN-SOURCE SCRIPT
Smooth First Derivative Indicator
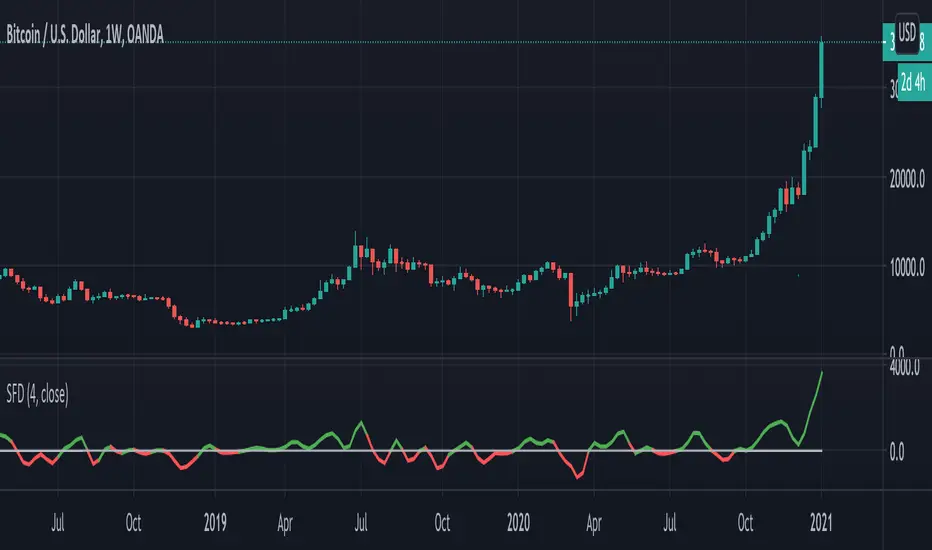
Introducing the Smooth First Derivative indicator. For each time step, the script numerically differentiates the price data using prior datapoints from the look-back window. The resulting time derivative (the rate of price change over time) is presented as a centered oscillator.
A first derivative is a versatile tool used in functional data analysis. When applied to price data, it can be applied to analyze momentum, confirm trend direction, and identify pivot points.
Model Description:
The model assumes that, within the look-back window, price data can be well approximated by a smooth differentiable function. The first derivative can then be computed numerically using a noise-robust one-sided differentiator. The current version of the script employs smooth differentiators developed by P. Holoborodko (holoborodko.com/pavel/numerical-methods/numerical-derivative/smooth-low-noise-differentiators/). Note that the Indicator should not be confused with Constance Brown's Derivative Oscillator.
Input parameter:
The Bandwidth parameter sets the number of points in the moving look-back window and thus determines the smoothness of the first derivative curve. Note that a smoother Indicator shows a greater lag.
Interpretation:
When using this Indicator, one should recall that the first derivative can simply be interpreted as the slope of the curve:
- The maximum (minimum) in the Indicator corresponds to the point at which the market experiences the maximum upward (downward) slope, i.e., the inflection point. The steeper the slope, the greater the Indicator value.
- The positive-to-negative zero-crossing in the Indicator suggests that the market has formed a local maximum (potential start of a downtrend or a period of consolidation). Likewise, a zero-crossing from negative to positive is a potential bullish signal.
オープンソーススクリプト
TradingViewの精神に則り、このスクリプトの作者はコードをオープンソースとして公開してくれました。トレーダーが内容を確認・検証できるようにという配慮です。作者に拍手を送りましょう!無料で利用できますが、コードの再公開はハウスルールに従う必要があります。
免責事項
この情報および投稿は、TradingViewが提供または推奨する金融、投資、トレード、その他のアドバイスや推奨を意図するものではなく、それらを構成するものでもありません。詳細は利用規約をご覧ください。
オープンソーススクリプト
TradingViewの精神に則り、このスクリプトの作者はコードをオープンソースとして公開してくれました。トレーダーが内容を確認・検証できるようにという配慮です。作者に拍手を送りましょう!無料で利用できますが、コードの再公開はハウスルールに従う必要があります。
免責事項
この情報および投稿は、TradingViewが提供または推奨する金融、投資、トレード、その他のアドバイスや推奨を意図するものではなく、それらを構成するものでもありません。詳細は利用規約をご覧ください。