OPEN-SOURCE SCRIPT
更新済 Double Inside Bar Finder
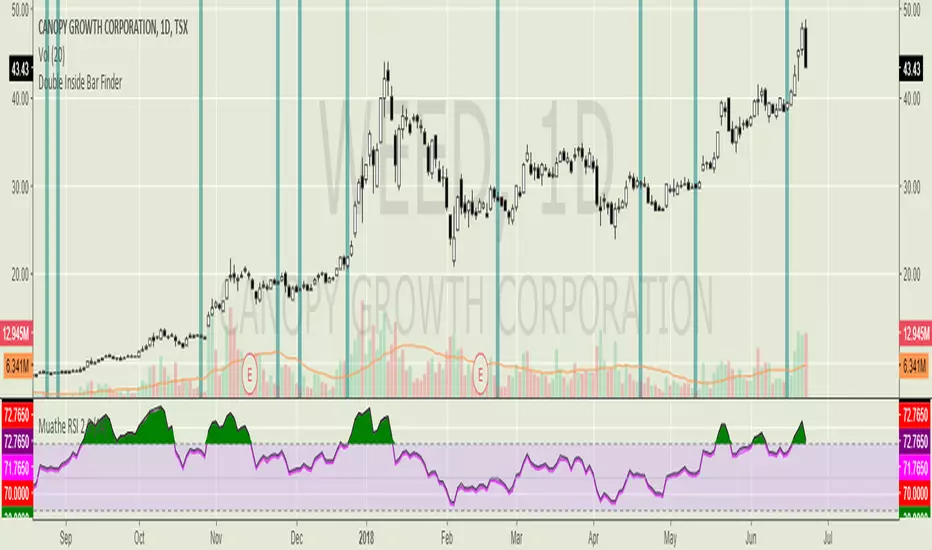
Highlights in blue when an inside bar follows an inside bar. Double inside bars (when used on the daily timeframe) are a way of easily finding equilibrium patterns (i.e. pennant shaped price action) on lower time frames. There is usually a strong move in whatever direction these patterns break, so good to have alerts set up for your favourite markets.
リリースノート
Fixed a code issue thanks to feedback from Indicator-Lover. Also added an option to change the relevant candle colours instead of having the vertical backgrounds as highlights.In my experience OBV (or a similar volume-based indicator) is often a good technique to see which way an inside bar is going to break. If it's trending up over the past few bars go long, and vice versa for short
リリースノート
Fixed an offsetting issueリリースノート
Fixed screenshotリリースノート
Added an option to change highlight colour based on the second inside candle. If it's red then the highlight will be red and vice versa for green.オープンソーススクリプト
TradingViewの精神に則り、このスクリプトの作者はコードをオープンソースとして公開してくれました。トレーダーが内容を確認・検証できるようにという配慮です。作者に拍手を送りましょう!無料で利用できますが、コードの再公開はハウスルールに従う必要があります。
免責事項
この情報および投稿は、TradingViewが提供または推奨する金融、投資、トレード、その他のアドバイスや推奨を意図するものではなく、それらを構成するものでもありません。詳細は利用規約をご覧ください。
オープンソーススクリプト
TradingViewの精神に則り、このスクリプトの作者はコードをオープンソースとして公開してくれました。トレーダーが内容を確認・検証できるようにという配慮です。作者に拍手を送りましょう!無料で利用できますが、コードの再公開はハウスルールに従う必要があります。
免責事項
この情報および投稿は、TradingViewが提供または推奨する金融、投資、トレード、その他のアドバイスや推奨を意図するものではなく、それらを構成するものでもありません。詳細は利用規約をご覧ください。