INVITE-ONLY SCRIPT
3-6-9 Times v3.2 (rdt)
3-6-9 Times v3.1 Indicator Overview
Core Concept
This indicator identifies specific times/dates where the digital root (sum of digits reduced to a single number) equals 3, 6, or 9, which are considered significant in numerology and certain trading methodologies.
How It Calculates Roots:
For Intraday Timeframes (minutes, hours):
Formula: Hour + First Minute Digit + Last Minute Digit → Reduce to single digit
For Daily/Weekly/Monthly Timeframes:
Uses Month + Day calculations with similar digit reduction logic.
Key Features:
1. Break Filter (Default: ON)
Only displays labels after a swing high/low is broken
Prevents clutter by filtering out times that don't coincide with price action
Configurable pivot length (default: 2 bars)
Optional directional filter: green candles must break highs, red candles must break lows
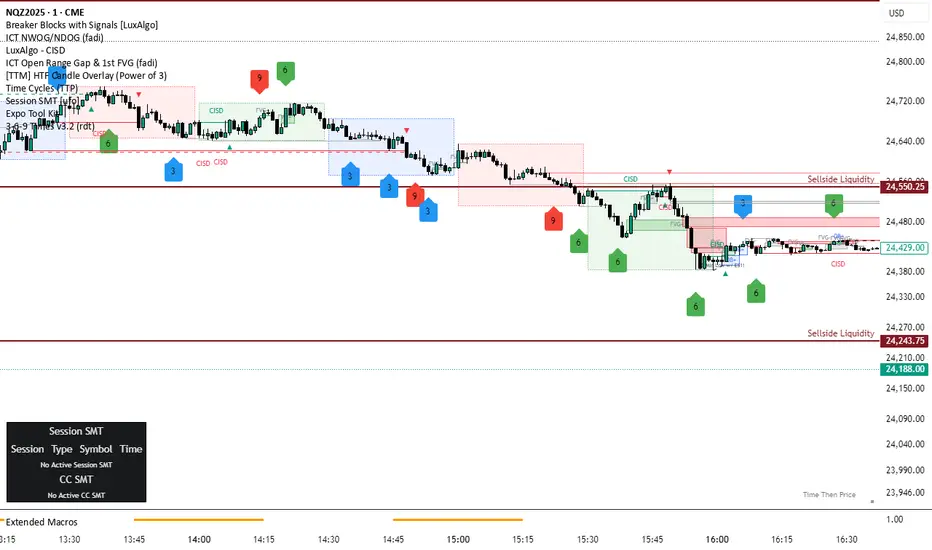
2. Root Selection
Toggle individual roots (3, 6, or 9) on/off
Each root has customizable color
Default colors: Blue (3), Green (6), Red (9)
3. Display Options
Marking Style: Labels, Vertical Lines, or Both
Label Text Format:
Root Only (default) - shows just "3", "6", or "9"
Time/Date Only - shows the actual time/date
Root + Time/Date (separate lines) - shows both
Label Background: Toggle colored box behind text (default: OFF)
Chart Background: Toggle colored background highlight (default: OFF)
Text Color: Customizable (default: black)
4. Session Filter:
Set specific hours/minutes for when to display signals
Default: 00:00 to 23:59 (all day)
Useful for focusing on specific trading sessions
5. Hour Offset
Manual adjustment for timezone/DST issues
Range: -12 to +12 hours
Helps align calculations with your preferred timezone
6. Label Placement
Green candles: Label appears above the bar
Red candles: Label appears below the bar
7. Alerts
Four alert conditions available:
Any 3-6-9 root hit
Specific Root 3 hit
Specific Root 6 hit
Specific Root 9 hit
Typical Use Case
Traders use this to identify potential reversal or continuation points when:
A 3/6/9 time occurs
Price breaks a recent swing high/low
Combining this timing signal with other technical analysis
The indicator helps identify "energetic" time windows that may correlate with increased volatility or directional moves.
Core Concept
This indicator identifies specific times/dates where the digital root (sum of digits reduced to a single number) equals 3, 6, or 9, which are considered significant in numerology and certain trading methodologies.
How It Calculates Roots:
For Intraday Timeframes (minutes, hours):
Formula: Hour + First Minute Digit + Last Minute Digit → Reduce to single digit
For Daily/Weekly/Monthly Timeframes:
Uses Month + Day calculations with similar digit reduction logic.
Key Features:
1. Break Filter (Default: ON)
Only displays labels after a swing high/low is broken
Prevents clutter by filtering out times that don't coincide with price action
Configurable pivot length (default: 2 bars)
Optional directional filter: green candles must break highs, red candles must break lows
2. Root Selection
Toggle individual roots (3, 6, or 9) on/off
Each root has customizable color
Default colors: Blue (3), Green (6), Red (9)
3. Display Options
Marking Style: Labels, Vertical Lines, or Both
Label Text Format:
Root Only (default) - shows just "3", "6", or "9"
Time/Date Only - shows the actual time/date
Root + Time/Date (separate lines) - shows both
Label Background: Toggle colored box behind text (default: OFF)
Chart Background: Toggle colored background highlight (default: OFF)
Text Color: Customizable (default: black)
4. Session Filter:
Set specific hours/minutes for when to display signals
Default: 00:00 to 23:59 (all day)
Useful for focusing on specific trading sessions
5. Hour Offset
Manual adjustment for timezone/DST issues
Range: -12 to +12 hours
Helps align calculations with your preferred timezone
6. Label Placement
Green candles: Label appears above the bar
Red candles: Label appears below the bar
7. Alerts
Four alert conditions available:
Any 3-6-9 root hit
Specific Root 3 hit
Specific Root 6 hit
Specific Root 9 hit
Typical Use Case
Traders use this to identify potential reversal or continuation points when:
A 3/6/9 time occurs
Price breaks a recent swing high/low
Combining this timing signal with other technical analysis
The indicator helps identify "energetic" time windows that may correlate with increased volatility or directional moves.
招待専用スクリプト
このスクリプトは作者が承認したユーザーのみアクセス可能です。使用するにはアクセス申請をして許可を得る必要があります。通常は支払い後に承認されます。詳細は下記の作者の指示に従うか、rdtdaleに直接お問い合わせください。
TradingViewは、作者を完全に信頼し、スクリプトの動作を理解していない限り、有料スクリプトの購入・使用を推奨しません。コミュニティスクリプトには無料のオープンソースの代替が多数あります。
作者の指示
Send me a DM for access.
免責事項
この情報および投稿は、TradingViewが提供または推奨する金融、投資、トレード、その他のアドバイスや推奨を意図するものではなく、それらを構成するものでもありません。詳細は利用規約をご覧ください。