INVITE-ONLY SCRIPT
Market Trading Tools - Auto Adjustable Support & Resistance
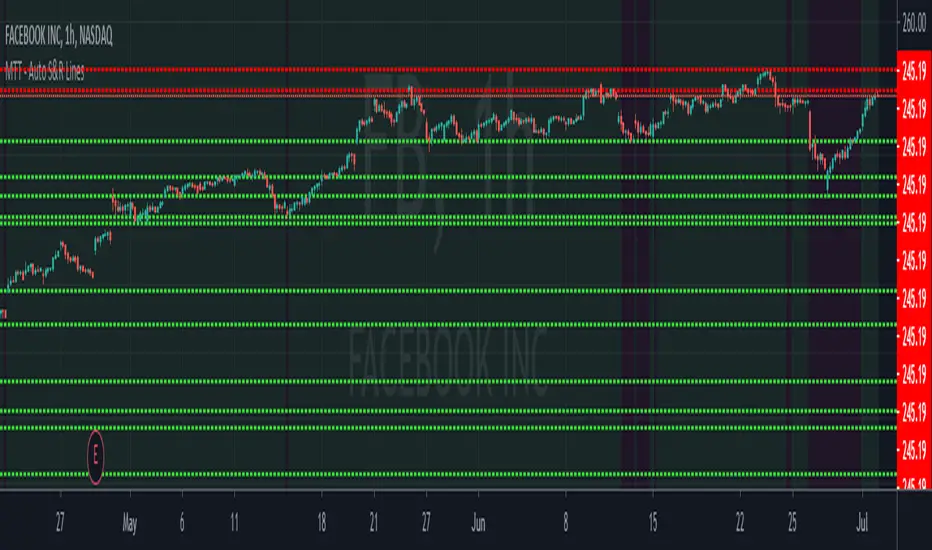
Our Auto Adjustable Support & Resistance indicator draws support and resistance lines that can help you estimate where a ticker or financial asset can range, reach or break. The support lines are in lime color while the resistance lines are in red. The colors will automatically change depending on where the candle is. So for example, if the candle is above the support line, the support line will be in lime, if it breaks that support line and closes below it, the same line will turn red becoming a resistance.
** The lines are adjustable, for example, if a stock or financial market broke a resistance and is moving to its all time high, then the line will keep moving with it until it rejects a certain zone. Accordingly, the supports below it will change to the nearest supports formed.
** The indicator can be used on any financial market; crypto, stocks or forex. We do not recommend a certain time frame as each time frame usually has its own support and resistance (the higher the time frame is the similar it will have same support and resistance zones, for example, a 4HR and 1 Day time frame might have similar support and resistance zones)
Once you are granted access to use it, add it from going into the scripts >> invite only scripts >> enable the indicator. Once the indicator is added to your chart you will see the indicator popping up on your chart.
We are happy to announce that our trading indicator is special and unique from different ones because it is adjustable to the current price ranges. We have also enabled a function for our users to get a better view of the trend when they add the indicator to their chart. You can now view the trend background color (red&green) depending on if the price is above the EMA of your choice. you can also check whichever time interval you want that does not limit you to the time interval chosen on your chart itself.
Hope you enjoy it, Good luck and stay safe!
** If you are interested in this indicator. please use the link below to obtain access to this indicator.
招待専用スクリプト
このスクリプトは作者が承認したユーザーのみアクセス可能です。使用するにはアクセス申請をして許可を得る必要があります。通常は支払い後に承認されます。詳細は下記の作者の指示に従うか、MarketTradingToolsに直接お問い合わせください。
TradingViewは、作者を完全に信頼し、スクリプトの動作を理解していない限り、有料スクリプトの購入・使用を推奨しません。コミュニティスクリプトには無料のオープンソースの代替が多数あります。
作者の指示
免責事項
この情報および投稿は、TradingViewが提供または推奨する金融、投資、トレード、その他のアドバイスや推奨を意図するものではなく、それらを構成するものでもありません。詳細は利用規約をご覧ください。