INVITE-ONLY SCRIPT
Ocean's Smart Structure [Pro]
Ocean's Smart Structure [Pro] – Professional Market Architecture
Stop guessing where the liquidity is.
Ocean's Smart Structure [Pro] is a next-generation technical analysis suite designed for precision traders. Unlike standard pivot indicators that clutter your chart with noise, it uses a Volatility-Adaptive Clustering Algorithm to merge, filter, and validate the levels that actually matter.
It doesn't just draw lines; it understands market behavior. It detects when support flips to resistance, identifies liquidity grabs (fakeouts), and visually indicates the strength of every zone.
🌊 Key Features
1. Volatility-Adaptive Clustering
Markets expand and contract. Standard indicators fail because they use static values. It calculates the Average True Range (ATR) in real-time to determine the effective width of a zone.
Result: Nearby pivots are intelligently merged into single, robust "Structural Clusters."
2. Advanced Role Reversal (Flip Logic)
Price rarely respects a level once. When a strong Support breaks, it often becomes Resistance.
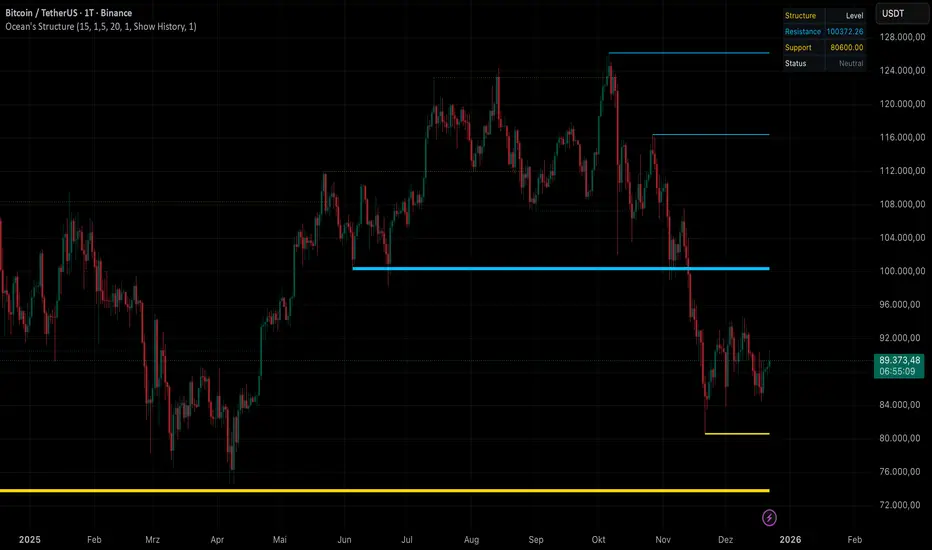
The Logic: The indicator automatically flips lines from Support (Gold) to Resistance (Blue) upon a confirmed break, keeping the history of that price level alive on your chart.
3. Institutional Fakeout Protection
The unique selling point of this tool. Algorithms often push price past a level to trigger stop-losses before reversing.
Standard Indicators: Delete the level immediately upon a break.
This Tool: Enters a "Pending Break" state. If the next candle reclaims the level, the line is preserved and strengthened, marking it as a Liquidity Grab rather than a breakout.
4. Dynamic Strength Visualization
Not all levels are equal.
Visual Feedback: As a level is tested more times without breaking, the line automatically becomes thicker. This allows you to instantly identify "Concrete Walls" vs. "Glass Windows" at a glance.
5. Real-Time HUD (Heads-Up Display)
A clean, non-intrusive dashboard sits on your chart, providing instant context:
Nearest Resistance & Support: Exact price ticks.
Live Status: Tells you if price is "Ranging," "At Support," or "At Resistance" based on volatility proximity.
⚙️ Settings & Customization
Pivot Period: Adjust sensitivity to swing highs/lows.
Cluster Sensitivity: Controls how aggressive the merging algorithm is.
Role Reversal Limit: Limit how many times a level can flip (preventing infinite ping-pong lines).
Invalidation Action: Choose to delete broken lines or keep them as "Ghost Levels" (dotted history).
Visuals: Fully customizable branding colors (Default: Gold & Neon Blue).
Stop guessing where the liquidity is.
Ocean's Smart Structure [Pro] is a next-generation technical analysis suite designed for precision traders. Unlike standard pivot indicators that clutter your chart with noise, it uses a Volatility-Adaptive Clustering Algorithm to merge, filter, and validate the levels that actually matter.
It doesn't just draw lines; it understands market behavior. It detects when support flips to resistance, identifies liquidity grabs (fakeouts), and visually indicates the strength of every zone.
🌊 Key Features
1. Volatility-Adaptive Clustering
Markets expand and contract. Standard indicators fail because they use static values. It calculates the Average True Range (ATR) in real-time to determine the effective width of a zone.
Result: Nearby pivots are intelligently merged into single, robust "Structural Clusters."
2. Advanced Role Reversal (Flip Logic)
Price rarely respects a level once. When a strong Support breaks, it often becomes Resistance.
The Logic: The indicator automatically flips lines from Support (Gold) to Resistance (Blue) upon a confirmed break, keeping the history of that price level alive on your chart.
3. Institutional Fakeout Protection
The unique selling point of this tool. Algorithms often push price past a level to trigger stop-losses before reversing.
Standard Indicators: Delete the level immediately upon a break.
This Tool: Enters a "Pending Break" state. If the next candle reclaims the level, the line is preserved and strengthened, marking it as a Liquidity Grab rather than a breakout.
4. Dynamic Strength Visualization
Not all levels are equal.
Visual Feedback: As a level is tested more times without breaking, the line automatically becomes thicker. This allows you to instantly identify "Concrete Walls" vs. "Glass Windows" at a glance.
5. Real-Time HUD (Heads-Up Display)
A clean, non-intrusive dashboard sits on your chart, providing instant context:
Nearest Resistance & Support: Exact price ticks.
Live Status: Tells you if price is "Ranging," "At Support," or "At Resistance" based on volatility proximity.
⚙️ Settings & Customization
Pivot Period: Adjust sensitivity to swing highs/lows.
Cluster Sensitivity: Controls how aggressive the merging algorithm is.
Role Reversal Limit: Limit how many times a level can flip (preventing infinite ping-pong lines).
Invalidation Action: Choose to delete broken lines or keep them as "Ghost Levels" (dotted history).
Visuals: Fully customizable branding colors (Default: Gold & Neon Blue).
招待専用スクリプト
このスクリプトは作者が承認したユーザーのみアクセス可能です。使用するにはアクセス申請をして許可を得る必要があります。通常は支払い後に承認されます。詳細は下記の作者の指示に従うか、ofeanに直接お問い合わせください。
TradingViewは、作者を完全に信頼し、スクリプトの動作を理解していない限り、有料スクリプトの購入・使用を推奨しません。コミュニティスクリプトには無料のオープンソースの代替が多数あります。
作者の指示
免責事項
この情報および投稿は、TradingViewが提供または推奨する金融、投資、トレード、その他のアドバイスや推奨を意図するものではなく、それらを構成するものでもありません。詳細は利用規約をご覧ください。