INVITE-ONLY SCRIPT
Yield Trend Indicator - The Quant Science
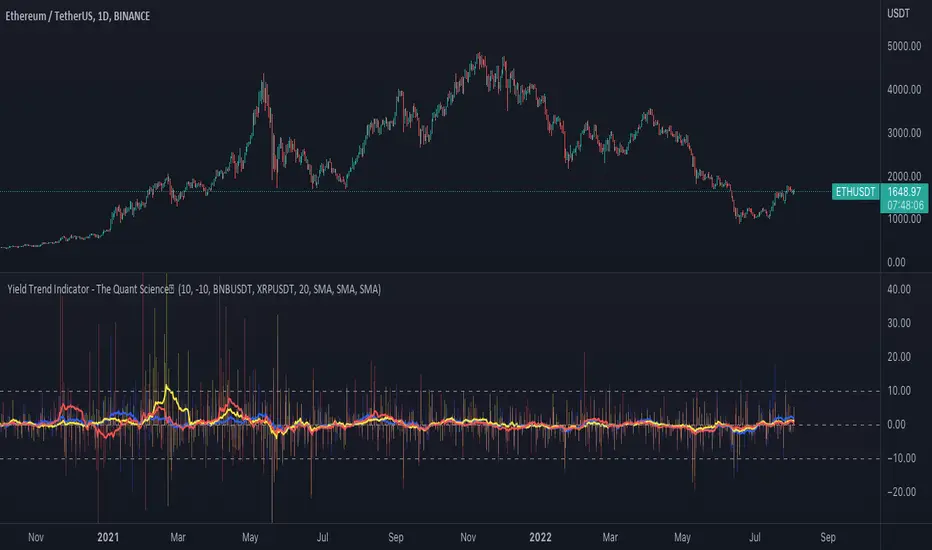
Yield Trend Indicator - The Quant Science™ is a quantitative indicator representing percentage yields and average percentage yields of three different assets.
Percentage yields are fundamental data for all quantitative analysts. This indicator was created to offer immediate calculations and represent them through an indicator consisting of lines and columns. The columns represent the percentage yield of the current timeframe, for each asset. The lines represent the average percentage yield, of the current timeframe, for each asset.
The user easily adds tickers from the user interface and the algorithm will automatically create the quantitative data of the chosen assets.
The blue refers to the main asset, the main set on the chart.
The yellow refers to the second asset, added by the user interface.
The red refers to the third asset, added by the user interface.
The timeframe is for all assets the one set to the chart, if you use a chart with timeframe D, all data is processed on this timeframe. You can use this indicator on all timeframes without any restrictions.
The user can change the type of formula for calculating the average yield easily via the user interface. This software includes the following formulas:
1. SMA (Simple Moving Average)
2. EMA (Exponential Moving Average)
3. WMA (Weighted Moving Average)
4. VWMA (Volume Weighted Moving Average)
The user can customize the indicator easily through the user interface, changing colours and many other parameters to represent the data on the chart.
招待専用スクリプト
このスクリプトは作者が承認したユーザーのみアクセス可能です。使用するにはアクセス申請をして許可を得る必要があります。通常は支払い後に承認されます。詳細は下記の作者の指示に従うか、thequantscienceに直接お問い合わせください。
TradingViewは、作者を完全に信頼し、スクリプトの動作を理解していない限り、有料スクリプトの購入・使用を推奨しません。コミュニティスクリプトには無料のオープンソースの代替が多数あります。
作者の指示
You can unlock this indicator from our website. For any information or questions about this script contact us on Trading View private chat.
免責事項
この情報および投稿は、TradingViewが提供または推奨する金融、投資、トレード、その他のアドバイスや推奨を意図するものではなく、それらを構成するものでもありません。詳細は利用規約をご覧ください。