INVITE-ONLY SCRIPT
Vola2vola volatility Trade & Trend
Hello everyone!
For those who remember Vola2vola volatility Trade & Trend script, we are excited to bring it back within the Myfractalrange Tradingview account!
If you already chose to have access to Vola2vola volatility indicator, this one is using the same formula but instead of having a separate indicator to display Volatility, Volatility has now been converted into price values, which makes it possible to visualise it on the ticker chart directly.
It is more volatile than Myfractalrange Trend but it will give you a complementary view on the asset current situation: Bullish/Bearish with an additional timeframe view named Trade.
As you know, Volatility is very important to assets and many people use it to trade. This tool automate the calculation of the volatility of every asset as well as provide an estimated value of its "Trend" and "Trade" projected onto price.
The idea in this script is to allow users to have an idea of the current volatility regime of the asset he is monitoring: Is its volatility Bullish or Bearish Trend, Bearish or Bullish Trade?
What are the data provided by the script:
- Trade : Trade is generated using an arbitrary and fixed look back period, it acts as a short-term Trend. It will give the user the possibility to know if the asset is still trending up or down short-term. Default colour is black
- Trend: Trend is also generated using an arbitrary and fixed look back period (20 times the one used for Trade), it acts as a longer-term view of the asset trendiness. It works the same way as Trade and will give the user the possibility to know if the volatility of the asset is trending a longer-term basis or not. Default colours are: red when the Trend of the asset is Bearish and green when the Trend of the asset is Bullish
Here are some of the questions you need to know the answer to before using this script:
- How do you define a "Bullish/Bearish Trade"? Volatility is Bullish Trade when Price is above Trade and it is Bearish Trade when Price is below Trade
- How do you define a "Bullish/Bearish Trend"? Volatility is Bullish Trend when Price is above Trend and it is Bearish Trend when Price is below Trend
- On which time frame should i use this script? You want to use the Daily time frame. Although, for short term moves in the volatility space, users could monitor the Hourly timeframe
Understanding the volatility of an asset, along with the bullish or bearish nature of its Trade and Trend, is crucial for investors. Assets that are Bullish Trend and Trade tend to appreciate in value, while those that are Bearish Trend and Trade tend to depreciate. Therefore, we recommend investors be aware of the volatility Trend and Trade situation of the asset they are holding in their portfolio.
Here are the different scenarios that you will encounter on a Daily timeframe and how to interpret them:
- Price is above Trade & Trend: It is the most Bullish set up for the price of an asset
- Price is below Trade & Trend: It is the most Bearish set up for the price of an asset
- Any other set up suggests uncertainty, caution is therefore recommended
These are some cases that you could experience while using this script:
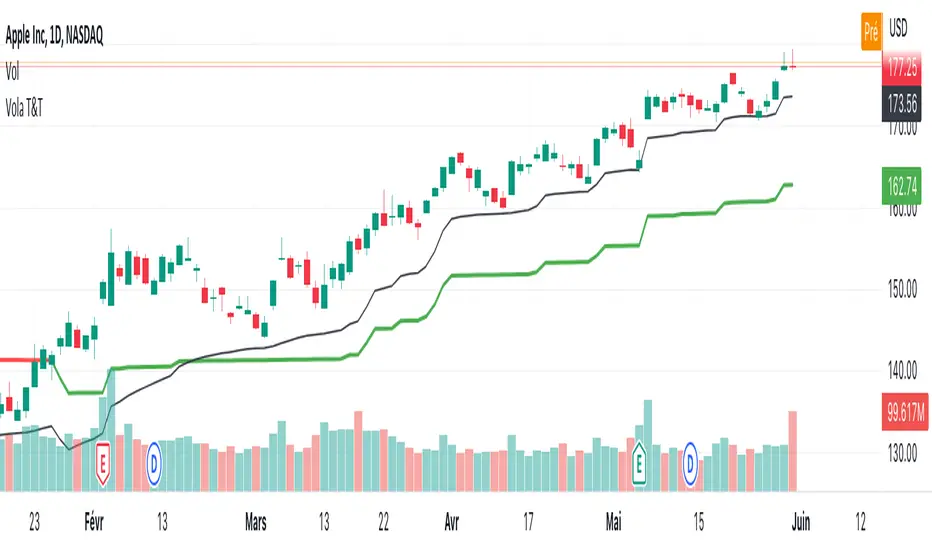
1) Bullish set up on a daily timeframe:

In this example using AAPL, when it is Bullish Trend and Trade on a daily timeframe, the price of AAPL tends to appreciate
2) Bearish set up on a daily timeframe:

In this example using IWM, when it is Bearish Trend and Trade on a daily timeframe, the price of IWM tends to depreciate
The idea of opening this script is to give you another layer of confidence when using our other scripts, especially when using Myfractalrange Trend.
We hope that you will find these explanations useful, please contact us by private message for access.
Enjoy!
DISCLAIMER: No sharing, copying, reselling, modifying, or any other forms of use are authorised. This script is strictly for individual use and educational purposes only. This is not financial or investment advice. Investments are always made at your own risk and are based on your personal judgement. Myfractalrange is not responsible for any losses you may incur. Please invest wisely.
For those who remember Vola2vola volatility Trade & Trend script, we are excited to bring it back within the Myfractalrange Tradingview account!
If you already chose to have access to Vola2vola volatility indicator, this one is using the same formula but instead of having a separate indicator to display Volatility, Volatility has now been converted into price values, which makes it possible to visualise it on the ticker chart directly.
It is more volatile than Myfractalrange Trend but it will give you a complementary view on the asset current situation: Bullish/Bearish with an additional timeframe view named Trade.
As you know, Volatility is very important to assets and many people use it to trade. This tool automate the calculation of the volatility of every asset as well as provide an estimated value of its "Trend" and "Trade" projected onto price.
The idea in this script is to allow users to have an idea of the current volatility regime of the asset he is monitoring: Is its volatility Bullish or Bearish Trend, Bearish or Bullish Trade?
What are the data provided by the script:
- Trade : Trade is generated using an arbitrary and fixed look back period, it acts as a short-term Trend. It will give the user the possibility to know if the asset is still trending up or down short-term. Default colour is black
- Trend: Trend is also generated using an arbitrary and fixed look back period (20 times the one used for Trade), it acts as a longer-term view of the asset trendiness. It works the same way as Trade and will give the user the possibility to know if the volatility of the asset is trending a longer-term basis or not. Default colours are: red when the Trend of the asset is Bearish and green when the Trend of the asset is Bullish
Here are some of the questions you need to know the answer to before using this script:
- How do you define a "Bullish/Bearish Trade"? Volatility is Bullish Trade when Price is above Trade and it is Bearish Trade when Price is below Trade
- How do you define a "Bullish/Bearish Trend"? Volatility is Bullish Trend when Price is above Trend and it is Bearish Trend when Price is below Trend
- On which time frame should i use this script? You want to use the Daily time frame. Although, for short term moves in the volatility space, users could monitor the Hourly timeframe
Understanding the volatility of an asset, along with the bullish or bearish nature of its Trade and Trend, is crucial for investors. Assets that are Bullish Trend and Trade tend to appreciate in value, while those that are Bearish Trend and Trade tend to depreciate. Therefore, we recommend investors be aware of the volatility Trend and Trade situation of the asset they are holding in their portfolio.
Here are the different scenarios that you will encounter on a Daily timeframe and how to interpret them:
- Price is above Trade & Trend: It is the most Bullish set up for the price of an asset
- Price is below Trade & Trend: It is the most Bearish set up for the price of an asset
- Any other set up suggests uncertainty, caution is therefore recommended
These are some cases that you could experience while using this script:
1) Bullish set up on a daily timeframe:
In this example using AAPL, when it is Bullish Trend and Trade on a daily timeframe, the price of AAPL tends to appreciate
2) Bearish set up on a daily timeframe:
In this example using IWM, when it is Bearish Trend and Trade on a daily timeframe, the price of IWM tends to depreciate
The idea of opening this script is to give you another layer of confidence when using our other scripts, especially when using Myfractalrange Trend.
We hope that you will find these explanations useful, please contact us by private message for access.
Enjoy!
DISCLAIMER: No sharing, copying, reselling, modifying, or any other forms of use are authorised. This script is strictly for individual use and educational purposes only. This is not financial or investment advice. Investments are always made at your own risk and are based on your personal judgement. Myfractalrange is not responsible for any losses you may incur. Please invest wisely.
招待専用スクリプト
このスクリプトは作者が承認したユーザーのみアクセス可能です。使用するにはアクセス申請をして許可を得る必要があります。通常は支払い後に承認されます。詳細は下記の作者の指示に従うか、myfractalrangeに直接お問い合わせください。
TradingViewは、作者を完全に信頼し、スクリプトの動作を理解していない限り、有料スクリプトの購入・使用を推奨しません。コミュニティスクリプトには無料のオープンソースの代替が多数あります。
作者の指示
To request access to this script, contact us directly by private message
Manage your portfolio using a Trend based system | Trial plans available on myfractalrange.com| ETFs, stocks, bonds, cryptos
免責事項
この情報および投稿は、TradingViewが提供または推奨する金融、投資、トレード、その他のアドバイスや推奨を意図するものではなく、それらを構成するものでもありません。詳細は利用規約をご覧ください。