PROTECTED SOURCE SCRIPT
DWP_Fabric_of_Time
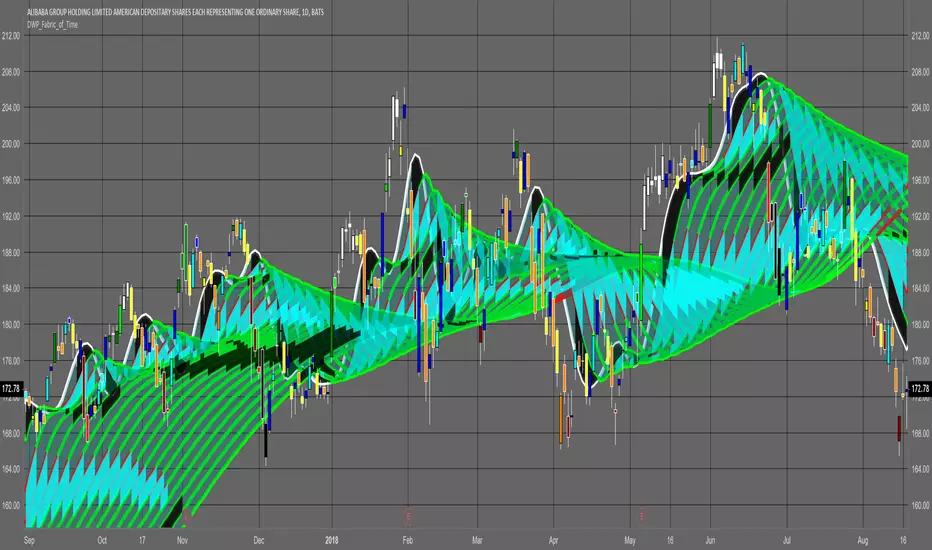
Hello, The following is an indicator I wrote that shows the resistance or support created by the contraction or expansion of moving averages of price over time. The theory is that the areas created by either the decline or acceleration of sma lines are caused by either fear or excitement in the market thus marking the area for future support or resistance to take place. The light blue blocks indicate a decrease in expansion till no expansion. The dark black blocks indicate a decrease in contraction till no contraction. Both blocks can be support or resistance. Once a block is breached look for a reversal. if the block is penetrated over half-way then it will usually continue to the other side before reversing. Their is a multiplier in the script to allow expansion of the indicator. I have also added a bar color indicator for the strength of the move. This can be turned on or off in settings. The colors are paired up as such.
Up = aqua, blue,green, lime,white. | Down = yellow, orange,maroon, red,black.
Hope this helps visualize the market.
Good Trading MoveTrap

Up = aqua, blue,green, lime,white. | Down = yellow, orange,maroon, red,black.
Hope this helps visualize the market.
Good Trading MoveTrap
保護スクリプト
このスクリプトのソースコードは非公開で投稿されています。 ただし、制限なく自由に使用できます – 詳細はこちらでご確認ください。
免責事項
この情報および投稿は、TradingViewが提供または推奨する金融、投資、トレード、その他のアドバイスや推奨を意図するものではなく、それらを構成するものでもありません。詳細は利用規約をご覧ください。
免責事項
この情報および投稿は、TradingViewが提供または推奨する金融、投資、トレード、その他のアドバイスや推奨を意図するものではなく、それらを構成するものでもありません。詳細は利用規約をご覧ください。