PROTECTED SOURCE SCRIPT
更新済 NJAlgoSignalv2
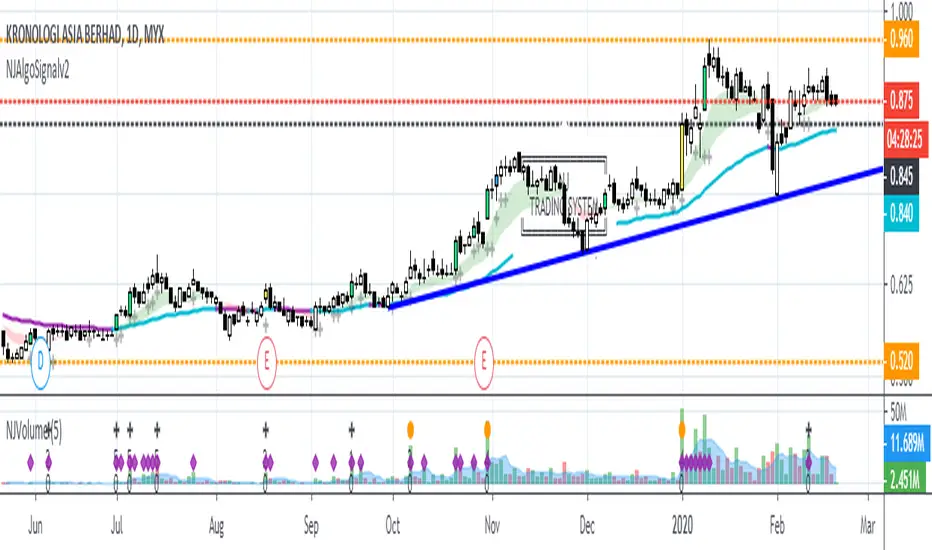
NJ-ALGO-SIGNAL
Combination of Price Breakout with Volume
Bar Color
Yellow = Breakout with Volume and Trend Change
Lime = Breakout with Volume
Blue = Breakout without Volume
Black Line = Trailing Stop Line
Sell when price break the Stop Loss Line.
Try to entry on Yellow and Lime Candle.
Can consider to exit when Blue Candle occur. Sign of weakness on uptrend.
Label
Shows only when bar color condition meet
Calculate risk level based on the current price and trailing stop loss line (Black Line).
52W High
By default is off.
Background Color
To Indicate Bullish or Bearish zone.
Green = Bullish zone
Red = Bearish zone
リリースノート
- Add 52Week High/Low Line- Add Trend Cloud
- Add EMA 50
- Show/Hide previous stop loss point
保護スクリプト
このスクリプトのソースコードは非公開で投稿されています。 ただし、制限なく自由に使用できます – 詳細はこちらでご確認ください。
免責事項
この情報および投稿は、TradingViewが提供または推奨する金融、投資、トレード、その他のアドバイスや推奨を意図するものではなく、それらを構成するものでもありません。詳細は利用規約をご覧ください。
保護スクリプト
このスクリプトのソースコードは非公開で投稿されています。 ただし、制限なく自由に使用できます – 詳細はこちらでご確認ください。
免責事項
この情報および投稿は、TradingViewが提供または推奨する金融、投資、トレード、その他のアドバイスや推奨を意図するものではなく、それらを構成するものでもありません。詳細は利用規約をご覧ください。