INVITE-ONLY SCRIPT
Fibonacci Dashboard-xbos.in
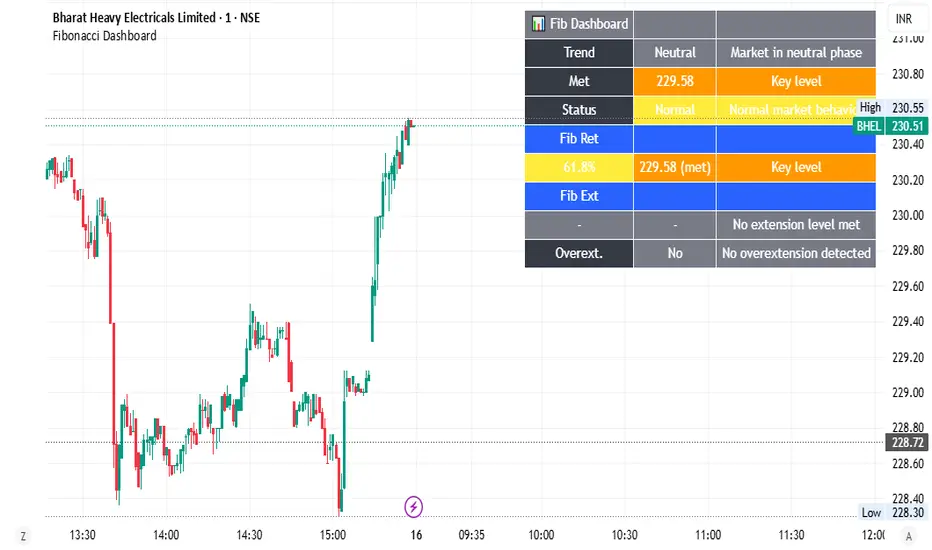
This Fibonacci Dashboard is a technical tool built in Pine Script that helps traders track key Fibonacci retracement and extension levels. It automatically detects the market trend—uptrend, downtrend, or neutral—and displays it with color-coded signals for easy interpretation.
It calculates retracement and extension levels from recent swing highs and lows, helping traders identify where price pullbacks or trend continuations are likely to occur. The retracement levels, like 0.236, 0.382, and 0.618, highlight areas where the price might temporarily correct, while extension levels, such as 1.272 and 1.618, point to zones of breakout or strong momentum.
The dashboard summarizes the current trend, the last Fibonacci level touched, and whether the structure is breaking or behaving normally. Traders can also set alerts on specific levels to be notified when price approaches or crosses them, ensuring timely action.
Additionally, the dashboard is customizable—you can adjust its position, choose which levels to display, and set thresholds for alerts. This makes it a flexible and user-friendly tool for analyzing trends and planning trades efficiently.Main Features
Trend Detection
Identifies whether the market is in an Uptrend, Downtrend, or Neutral based on price movements.
Highlights trends with color-coded signals:
✅ Green → Uptrend
❌ Red → Downtrend
⚪ Gray → Neutral
Fibonacci Levels
Calculates both retracement and extension levels from swing highs and lows.
Helps identify where price corrections and continuations might occur.
Retracement Levels
Shows key Fibonacci retracement ratios:
Extension Levels
Shows key Fibonacci extension ratios
Dashboard Display
Summarizes trend, last met Fibonacci level, and overall market structure.
Provides details about whether the price is at a retracement or extension level and what it means.
Status field signals whether the structure is breaking, a breakout is occurring, or the market is behaving normally.
Alerts
You can set alerts on specific retracement and extension levels.
Alerts are triggered when the price crosses or approaches these levels within a tolerance threshold.
Customization
Dashboard position can be adjusted (top-right, top-left, bottom-right, bottom-left).
Volume threshold for triggering alerts is customizable.
Show/hide retracements and extensions.
招待専用スクリプト
こちらのスクリプトにアクセスできるのは投稿者が承認したユーザーだけです。投稿者にリクエストして使用許可を得る必要があります。通常の場合、支払い後に許可されます。詳細については、以下、作者の指示をお読みになるか、xbosに直接ご連絡ください。
スクリプトの機能を理解し、その作者を全面的に信頼しているのでなければ、お金を支払ってまでそのスクリプトを利用することをTradingViewとしては「非推奨」としています。コミュニティスクリプトの中で、その代わりとなる無料かつオープンソースのスクリプトを見つけられる可能性もあります。
作者の指示
The Fibonacci Dashboard is a user-friendly tool that tracks key retracement and extension levels, identifies market trends with color-coded signals, and provides customizable alerts to help traders plan entries and exits more effectively.
Powered by XBOS – Technical setups made simple 📈 | xbos.in
免責事項
これらの情報および投稿は、TradingViewが提供または保証する金融、投資、取引、またはその他の種類のアドバイスや推奨を意図したものではなく、またそのようなものでもありません。詳しくは利用規約をご覧ください。