OPEN-SOURCE SCRIPT
更新済 Daily ATR Cave
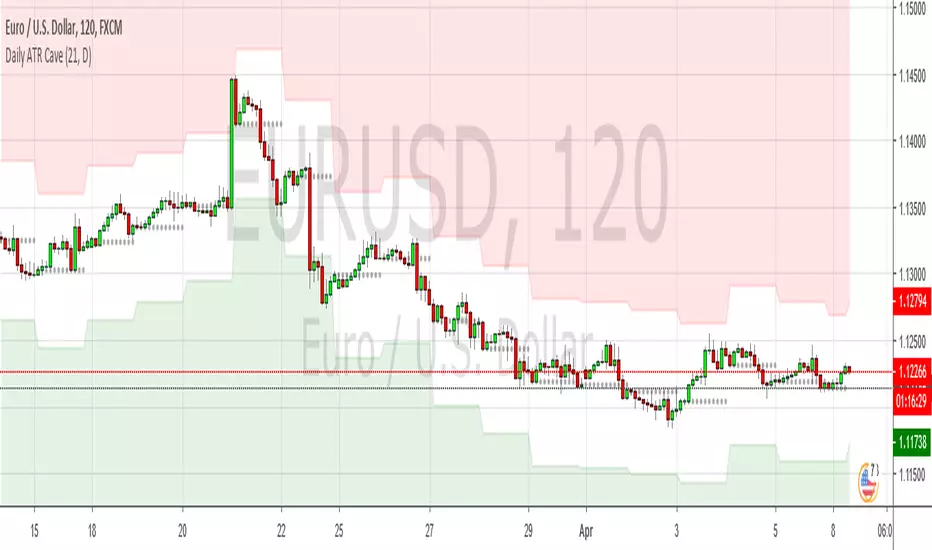
Similar to the RSI Cave idea, this plots daily Average True Range values on lower timeframes, as well as the daily open level, which is show as a grey dotted line. Basically a simple way to visualise basic mean reversion stuff
リリースノート
Updated code to use tickerid instead of ticker. This makes sure the code is referencing the current exchange and ticker, not just the ticker. Thanks to @k_dub1 for the tipオープンソーススクリプト
TradingViewの精神に則り、このスクリプトの作者はコードをオープンソースとして公開してくれました。トレーダーが内容を確認・検証できるようにという配慮です。作者に拍手を送りましょう!無料で利用できますが、コードの再公開はハウスルールに従う必要があります。
免責事項
この情報および投稿は、TradingViewが提供または推奨する金融、投資、トレード、その他のアドバイスや推奨を意図するものではなく、それらを構成するものでもありません。詳細は利用規約をご覧ください。
オープンソーススクリプト
TradingViewの精神に則り、このスクリプトの作者はコードをオープンソースとして公開してくれました。トレーダーが内容を確認・検証できるようにという配慮です。作者に拍手を送りましょう!無料で利用できますが、コードの再公開はハウスルールに従う必要があります。
免責事項
この情報および投稿は、TradingViewが提供または推奨する金融、投資、トレード、その他のアドバイスや推奨を意図するものではなく、それらを構成するものでもありません。詳細は利用規約をご覧ください。