OPEN-SOURCE SCRIPT
更新済 Inverse Bands
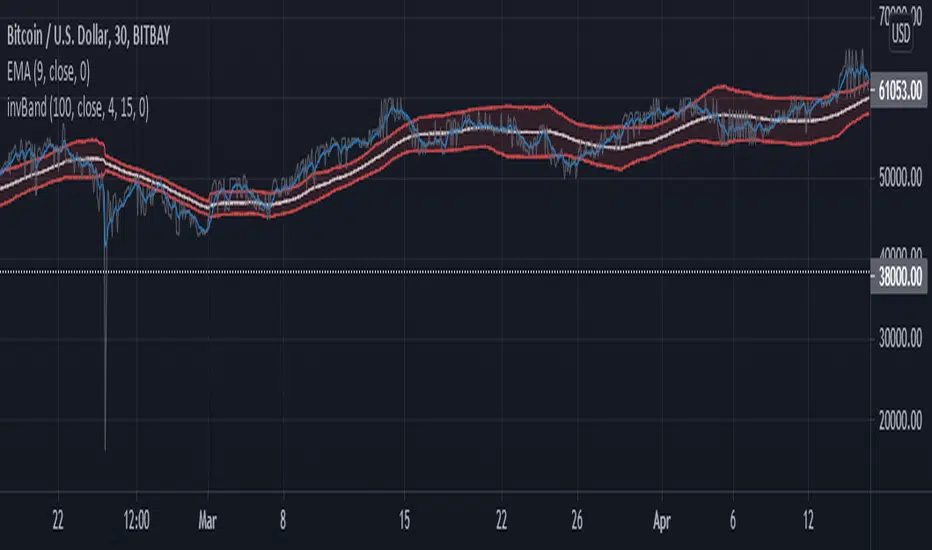
I'm very new to trading. I've been toying with moving averages to trigger swing trades and wanted an indicator that would swell when price moves sideways and squeeze when price is trending.
So this is the inverse of the popular Bollinger Bands indicator. It makes a very easy identifier for price breakout when paired with your favorite fast moving average. When MA falls outside the bands, it indicates an emerging trend. Still requires some curve fitting, but it is a work in progress.
I hope this isn't a direct copy of something I am not aware of.
リリースノート
Worked out a reliable way to invert Bol Bands across a wider price range. Still needs some curve fitting via "Length" and "X Offset" settings. In future revisions ill try to automate the fitting based on current price maybe. Until then we will have to manually fit the settings.リリースノート
Squared the percentage, not totally sure it helped. Did some fine tuning with settings, and changed the label of X offset to width, because that is essentially what it does.オープンソーススクリプト
TradingViewの精神に則り、このスクリプトの作者はコードをオープンソースとして公開してくれました。トレーダーが内容を確認・検証できるようにという配慮です。作者に拍手を送りましょう!無料で利用できますが、コードの再公開はハウスルールに従う必要があります。
免責事項
この情報および投稿は、TradingViewが提供または推奨する金融、投資、トレード、その他のアドバイスや推奨を意図するものではなく、それらを構成するものでもありません。詳細は利用規約をご覧ください。
オープンソーススクリプト
TradingViewの精神に則り、このスクリプトの作者はコードをオープンソースとして公開してくれました。トレーダーが内容を確認・検証できるようにという配慮です。作者に拍手を送りましょう!無料で利用できますが、コードの再公開はハウスルールに従う必要があります。
免責事項
この情報および投稿は、TradingViewが提供または推奨する金融、投資、トレード、その他のアドバイスや推奨を意図するものではなく、それらを構成するものでもありません。詳細は利用規約をご覧ください。