PROTECTED SOURCE SCRIPT
更新済 Ultimate RSI

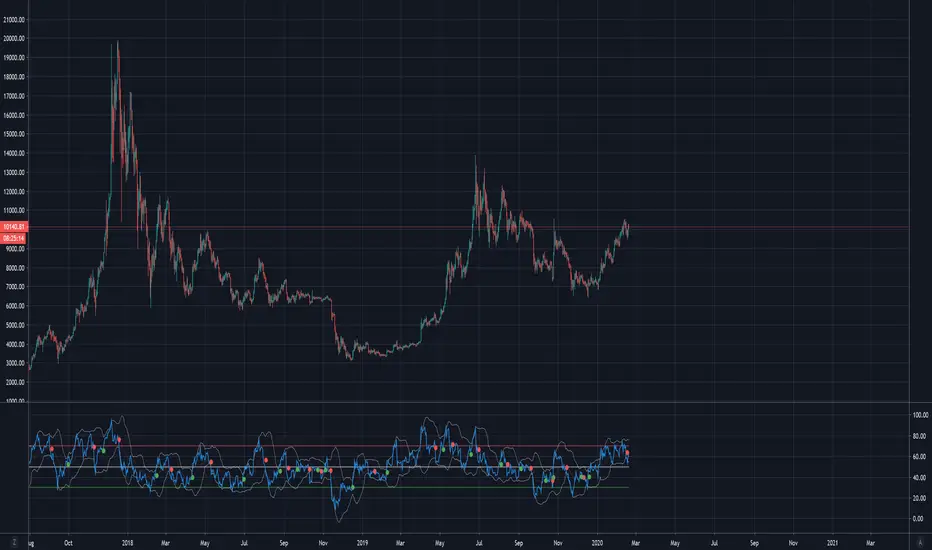
RSI w/BBands and 12 period moving average.
BBands show the standard deviation of the RSI, and can therefore suggest if a trend is oversold or overbought in conjunction with the 30 and 70 RSI values. A tightening of the BBands also suggests a major move/trend change is immanent.
The RSI moving average can suggest if the RSI is in a bullish or bearish trend . So if RSI>RSIMA then bullish trend , and if RSI<RSIMA then bearish trend . The RSIMA can also be used as another way to determine the true RSI values by eliminating noise and big sudden price movements (e.g. liquidation wicks). So for example if the RSIMA is at 70, then we know the asset is oversold etc
リリースノート
Ultimate RSI w/BB+EMA's保護スクリプト
このスクリプトのソースコードは非公開で投稿されています。 ただし、制限なく自由に使用できます – 詳細はこちらでご確認ください。
免責事項
この情報および投稿は、TradingViewが提供または推奨する金融、投資、トレード、その他のアドバイスや推奨を意図するものではなく、それらを構成するものでもありません。詳細は利用規約をご覧ください。
保護スクリプト
このスクリプトのソースコードは非公開で投稿されています。 ただし、制限なく自由に使用できます – 詳細はこちらでご確認ください。
免責事項
この情報および投稿は、TradingViewが提供または推奨する金融、投資、トレード、その他のアドバイスや推奨を意図するものではなく、それらを構成するものでもありません。詳細は利用規約をご覧ください。