PROTECTED SOURCE SCRIPT
更新済 Dollar Cost Averaging Only Red Candles
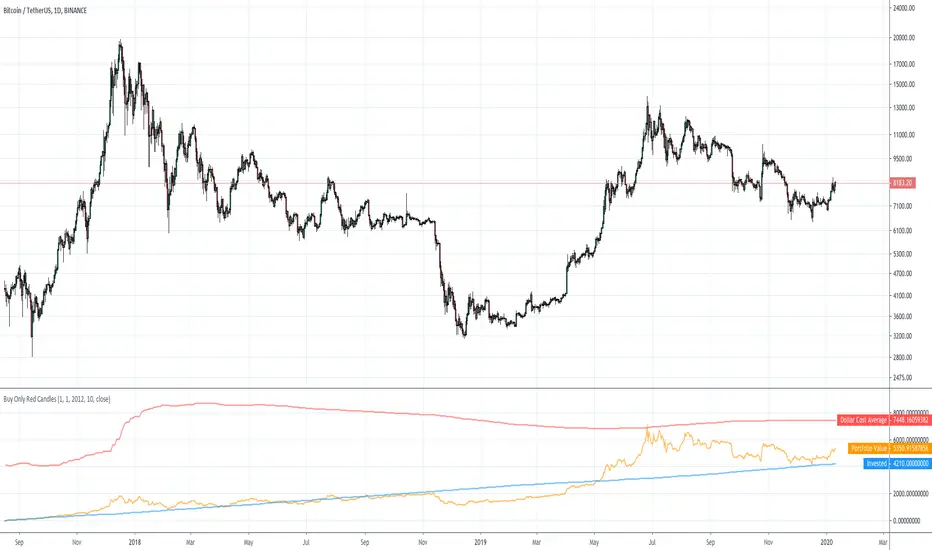
This just shows you the results if, for example, you bought the closing price each day that formed a red candle.
Works on other timeframes than daily.
In the options you can set your own start date, as well as the dollar amount to spend on each buy.
Displays your dollar cost average, total invested, and total portfolio value over time.
Works on other timeframes than daily.
In the options you can set your own start date, as well as the dollar amount to spend on each buy.
Displays your dollar cost average, total invested, and total portfolio value over time.
リリースノート
Fixed some problems, plus added an option in the settings to choose your source (open, close, low, high, etc).保護スクリプト
このスクリプトのソースコードは非公開で投稿されています。 ただし、制限なく自由に使用できます – 詳細はこちらでご確認ください。
免責事項
この情報および投稿は、TradingViewが提供または推奨する金融、投資、トレード、その他のアドバイスや推奨を意図するものではなく、それらを構成するものでもありません。詳細は利用規約をご覧ください。
免責事項
この情報および投稿は、TradingViewが提供または推奨する金融、投資、トレード、その他のアドバイスや推奨を意図するものではなく、それらを構成するものでもありません。詳細は利用規約をご覧ください。