PROTECTED SOURCE SCRIPT
HTF Open Cross — Multi-Symbol Scanner V2
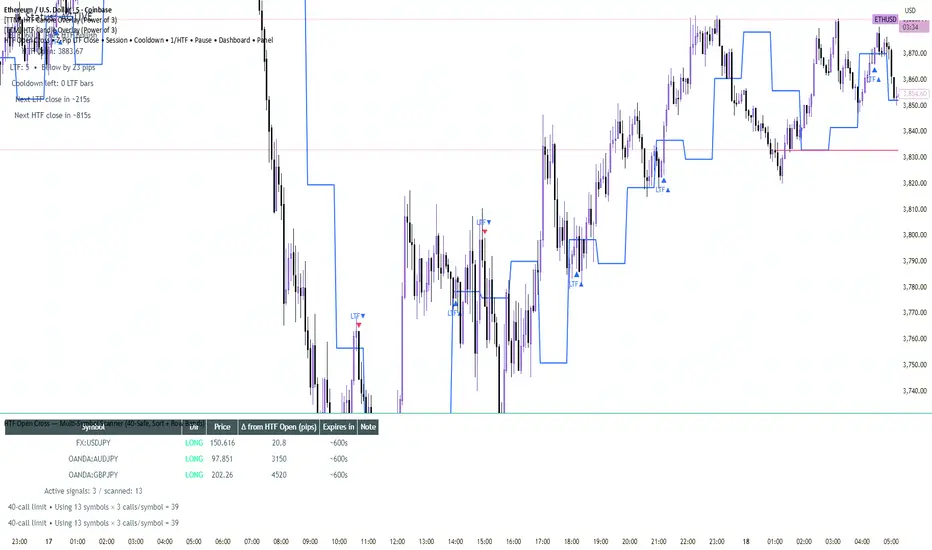
The HTF Open Cross — Multi-Symbol Smart Scanner is a professional-grade dashboard that continuously monitors up to 20 instruments for lower-timeframe (LTF) price crosses relative to their higher-timeframe (HTF) open.
Each detected signal represents a momentum confirmation — when a lower timeframe candle closes beyond the HTF open by a configurable Z-threshold in pips, in alignment with the previous HTF candle bias (bullish or bearish).
🔍 Key Features
📊 Multi-Instrument Scan: Evaluate up to 20 tickers simultaneously, with independent LTF/HTF pairings.
⏰ Active Signal Tracking: Displays only signals fired within a user-defined expiry window (e.g., last 10 minutes).
🧭 Session-Aware Filtering: Signals are valid only during active market sessions (customizable).
🧮 Auto Pip Detection: Automatically detects appropriate pip scaling for FX and JPY pairs.
🧱 Zebra Table Bands: Alternating row colors for visual clarity.
🔄 Smart Sorting: Arrange the dashboard by LONGs first, expiry soonest, or expiry latest.
⏳ Countdown Timer: Each signal shows remaining time until expiry for fast decision-making.
🎯 Real-Time Bias View: See at a glance which markets are currently biased LONG or SHORT relative to their HTF opens.
⚙️ How It Works
The script calls request.security() to fetch HTF and LTF data for each symbol.
It detects cross conditions:
LONG = previous HTF bullish + LTF close ≥ HTF open + threshold
SHORT = previous HTF bearish + LTF close ≤ HTF open − threshold
Each signal is timestamped, age-filtered, and stored in sortable arrays.
The table dashboard refreshes dynamically to show only active signals, color-coded and ranked.
🧭 Use Cases
Identify when momentum aligns across multiple instruments.
Spot early bias shifts between sessions.
Create alerts for systematic scalping or bias confirmation models.
保護スクリプト
このスクリプトのソースコードは非公開で投稿されています。 しかし、無料かつ制限なしでご利用いただけます ― 詳細についてはこちらをご覧ください。
免責事項
これらの情報および投稿は、TradingViewが提供または保証する金融、投資、取引、またはその他の種類のアドバイスや推奨を意図したものではなく、またそのようなものでもありません。詳しくは利用規約をご覧ください。
免責事項
これらの情報および投稿は、TradingViewが提供または保証する金融、投資、取引、またはその他の種類のアドバイスや推奨を意図したものではなく、またそのようなものでもありません。詳しくは利用規約をご覧ください。