Dest123

VolumeVsVSMAComparison

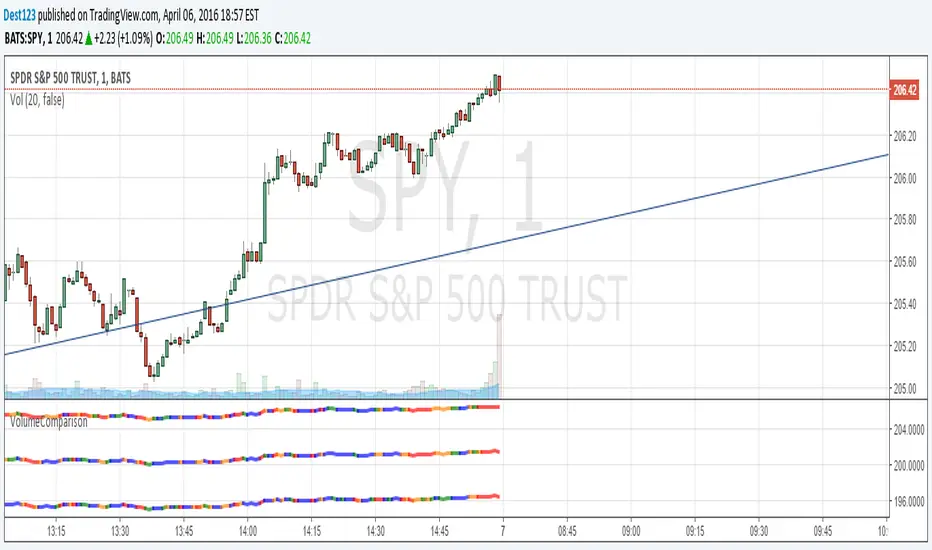
Shows 3 bars. One for the 100sma, one for 25sma, and one for 5sma. The bar color is blue if it's "low volume" compared to the sma, green if it's about average, yellow if it's high, and red if it's very high.

Top bar is 100sma, middle is 25, and bottom is 5
オープンソーススクリプト

TradingViewの精神に則り、このスクリプトの作者は、トレーダーが理解し検証できるようにオープンソースで公開しています。作者に敬意を表します!無料で使用することができますが、このコードを投稿で再利用するには、ハウスルールに準拠する必要があります。 お気に入りに登録してチャート上でご利用頂けます。

免責事項

これらの情報および投稿は、TradingViewが提供または保証する金融、投資、取引、またはその他の種類のアドバイスや推奨を意図したものではなく、またそのようなものでもありません。詳しくは利用規約をご覧ください。

チャートでこのスクリプトを利用したいですか?
//@version=2
study("VolumeVsVSMAComparison")
//strategy("Testing")

//changePosition(up) =>
  //  strategy.close_all()
//    up ? strategy.entry("buy", strategy.long, 10) : strategy.entry("sell", strategy.short, 10)
  //  up

smaVal = 100
lowVolume = volume < sma(volume,smaVal)*0.8
highVolume = volume > sma(volume,smaVal)*1.5
mediumHighVolume = volume > sma(volume,smaVal)*1

smaVal2 = 25
lowVolume2 = volume < sma(volume,smaVal2)*0.8
highVolume2 = volume > sma(volume,smaVal2)*1.5
mediumHighVolume2 = volume > sma(volume,smaVal2)*1

smaVal3 = 5
lowVolume3 = volume < sma(volume,smaVal3)*0.8
highVolume3 = volume > sma(volume,smaVal3)*1.5
mediumHighVolume3 = volume > sma(volume,smaVal3)*1

change = sma((close-open),1)
goingUp = ((change > change[1]))// and (change[1] > change[2]))

plot(close,"", lowVolume ? blue : highVolume ? red : mediumHighVolume ? orange : green, linewidth=3)
plot(close-5,"", lowVolume2 ? blue : highVolume2 ? red : mediumHighVolume2 ? orange : green, linewidth=3)
plot(close-10,"", lowVolume3 ? blue : highVolume3 ? red : mediumHighVolume3 ? orange : green, linewidth=3)

//changePosition(goingUp)
//if (not na(goingUp[1]))
    //if (goingUp != goingUp[1])
        //if ((lowVolume[1] or lowVolume[2]) and highVolume) or (highVolume[1] and not highVolume)
        //if goingUp
            //strategy.entry("buy", strategy.long, strategy.position_size == 0 ? 10 : 20)
        //else
//            strategy.entry("sell", strategy.short, strategy.position_size == 0 ? 10 : 20)

//plot(strategy.equity, "", blue)
//plot(strategy.netprofit+100)
//plot(close, "", (goingUp ? green : red))
//plot(open, "", (((sma(open,3) > sma(open,3)[1]) and (sma(open,3)[1] > sma(open,3)[2])) ? green : red))

//plot(macd, color=blue)
//plot(signal, color=orange)