PROTECTED SOURCE SCRIPT
更新済 Price/Moving Average
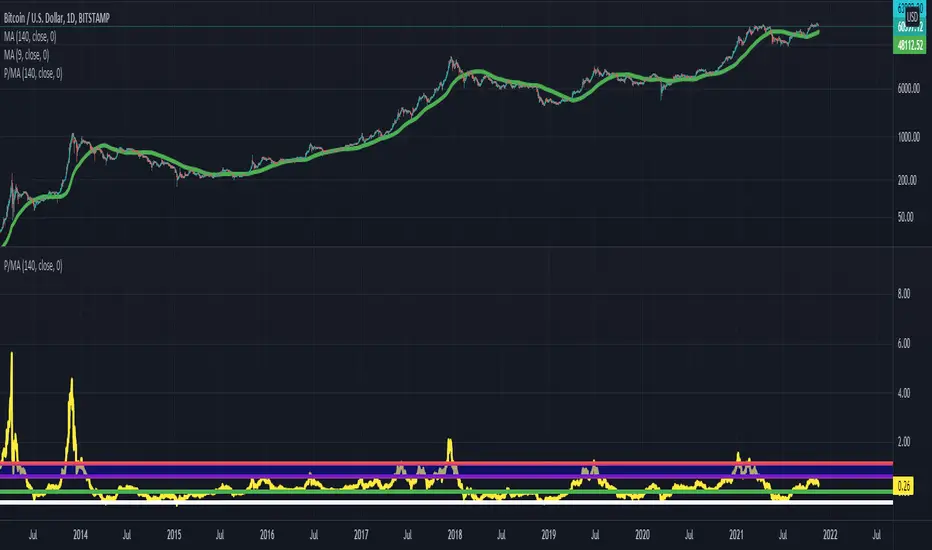
Price / Moving average indicator.
Support and resistance levels are established for Bitcoin.
When in a bear market, -50% below the 20 week MA acts as support.
When in a bull market, between 60% to 100% above the 20 week MA acts as resistance. Historically, these levels once hit, send Bitcoin back down to it's 20 week moving average.
In the setting of a bear market, historically, we do not ever get up to the 60% above the 20 week MA level.
Please note, this is only based on historical trends, and is not guaranteed to remain true in this or future market cycles.
リリースノート
Remember, these values for support and resistance are not exact, in reality they vary by about 5-10% per cycle historically.保護スクリプト
このスクリプトのソースコードは非公開で投稿されています。 ただし、制限なく自由に使用できます – 詳細はこちらでご確認ください。
免責事項
この情報および投稿は、TradingViewが提供または推奨する金融、投資、トレード、その他のアドバイスや推奨を意図するものではなく、それらを構成するものでもありません。詳細は利用規約をご覧ください。
免責事項
この情報および投稿は、TradingViewが提供または推奨する金融、投資、トレード、その他のアドバイスや推奨を意図するものではなく、それらを構成するものでもありません。詳細は利用規約をご覧ください。