INVITE-ONLY SCRIPT
更新済 $ADD Indicator
Sign up at https://ticksurfers.com
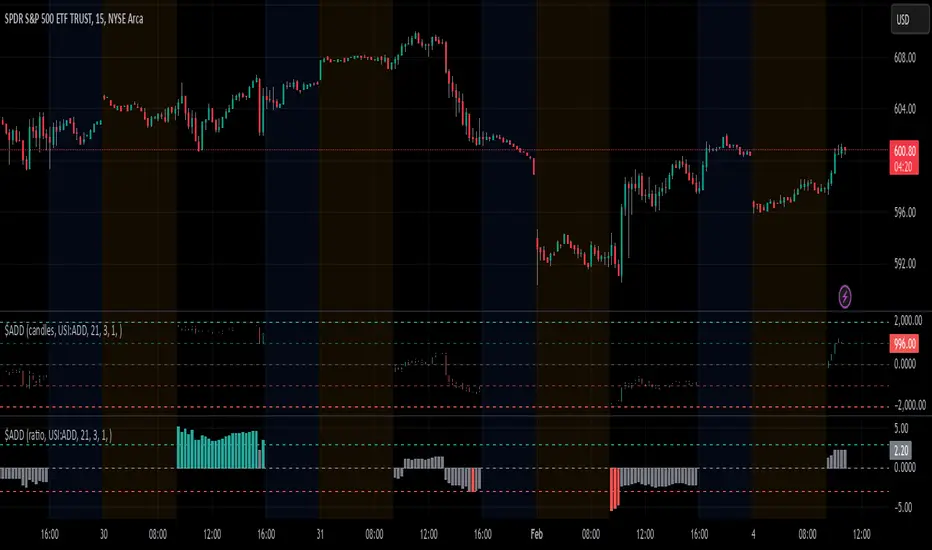
In index investment, the USI:ADD is the Advance Decline Index that can be plotted in most charting platforms. Just like there is a volatility index for most major indeces (VIX, VOLQ) and even for Apple (CBOE:VXAPL), USI:ADD also has variations specific for the index you are analyzing (SPX: ADD, NASDAQ: ADDQ).
The USI:ADD index is a measurement of stocks in the index that are advancing (bullish) minus those that are declining (bearish).
The basic idea of how to use the ADD index is that when the value is above 1000 it is considered overbought. Conversely, when the value is below -1000 it is considered oversold. When the value is near the medium line, it is not a good idea to trade as it is considered to be in a choppy market.
リリースノート
Fixed bug with breadth thrust calculationリリースノート
Updated ratio mode to highlight high ADD ratio, indicating potential of a trend day.招待専用スクリプト
このスクリプトは作者が承認したユーザーのみアクセス可能です。使用するにはアクセス申請をして許可を得る必要があります。通常は支払い後に承認されます。詳細は下記の作者の指示に従うか、TickSurfersに直接お問い合わせください。
このプライベートの招待専用スクリプトはモデレーターによる審査を受けておらず、ハウスルールへの準拠状況は未確認です。 TradingViewは、作者を完全に信頼し、スクリプトの動作を理解していない限り、有料スクリプトの購入・使用を推奨しません。コミュニティスクリプトには無料のオープンソースの代替が多数あります。
作者の指示
Sign up at ticksurfers.com for access.
免責事項
この情報および投稿は、TradingViewが提供または推奨する金融、投資、トレード、その他のアドバイスや推奨を意図するものではなく、それらを構成するものでもありません。詳細は利用規約をご覧ください。
招待専用スクリプト
このスクリプトは作者が承認したユーザーのみアクセス可能です。使用するにはアクセス申請をして許可を得る必要があります。通常は支払い後に承認されます。詳細は下記の作者の指示に従うか、TickSurfersに直接お問い合わせください。
このプライベートの招待専用スクリプトはモデレーターによる審査を受けておらず、ハウスルールへの準拠状況は未確認です。 TradingViewは、作者を完全に信頼し、スクリプトの動作を理解していない限り、有料スクリプトの購入・使用を推奨しません。コミュニティスクリプトには無料のオープンソースの代替が多数あります。
作者の指示
Sign up at ticksurfers.com for access.
免責事項
この情報および投稿は、TradingViewが提供または推奨する金融、投資、トレード、その他のアドバイスや推奨を意図するものではなく、それらを構成するものでもありません。詳細は利用規約をご覧ください。