PROTECTED SOURCE SCRIPT
更新済 Dynamical Support and Resistance [Fournier-Eaton]
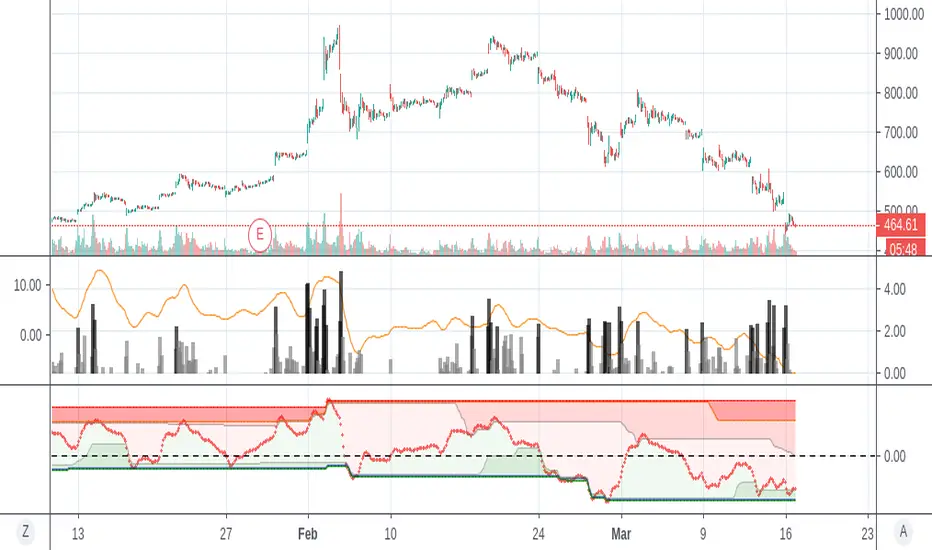
The Dynamical Support and Resistance Indicator finds support and resistance levels.
The plot is price relative: if the indicator nears one of its supports or resistances then the price is likewise nearing a support.
The levels are dynamical: once a support or resistance is broken, a new calculation is performed.
There are 3 supports and 3 resistances each with a longer time-frame. Breaking through the first shouldn't signal much, breaking through the third is programmed to only happen at a significant number of standard deviations.
Enjoy. Feedback appreciated
リリースノート
- Clearer Upper and lower levels
- Enhanced performance in higher volatility
- More responsive tight-bound levels.
リリースノート
- Clearer zones by coloring- Better self-adjusting look-back.
保護スクリプト
このスクリプトのソースコードは非公開で投稿されています。 ただし、制限なく自由に使用できます – 詳細はこちらでご確認ください。
免責事項
この情報および投稿は、TradingViewが提供または推奨する金融、投資、トレード、その他のアドバイスや推奨を意図するものではなく、それらを構成するものでもありません。詳細は利用規約をご覧ください。
免責事項
この情報および投稿は、TradingViewが提供または推奨する金融、投資、トレード、その他のアドバイスや推奨を意図するものではなく、それらを構成するものでもありません。詳細は利用規約をご覧ください。