PROTECTED SOURCE SCRIPT
更新済 Scalp King v2.0 - Multi-time VWAP, multi-condition alerts
Multi time-range VWAP with Multiple condition alerts - version 2.0 - by Viral Killer
This is a script that contains 3 VWAP modes, 5 min, 60 min and 240 min timeframes, all on the same indicator. You add it to the 5 min chart, but seems to work on other ranges.
Usually, when the VWAP wave crosses above, it is a buy signal, although not perfect. This ensures there is also a MAC-D buy confirmation, for a much stronger buy signal.
You can setup SUPER alerts which ensure multiple time ranges line up, before alerting. Some are already built in.
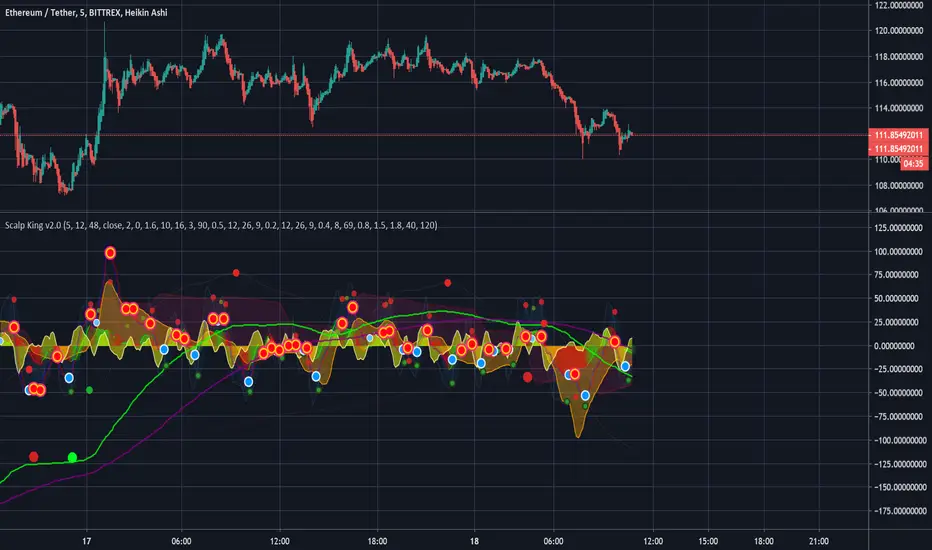
Yellow Wave is 5 min VWAP , crossing from below into positive is a buy signal. Note the word signal, not guaranteed buy.
Orange Wave is 60 min VWAP , crossing from below into positive is a buy signal.
Purple Wave is 240 min VWAP , crossing from below into positive is a buy signal.
The blue wave is 5 the minutes RSI and the other lines are 1h/4h, corresponding to oversold and overbought signals.
U will see a trail of red and blue arrows on the MAC-D, this script knows when the MAC-D is losing power.
Green dots are a buy, dark dots are a sell. Green with orange rim is a weak buy.
If you see 2 or 3 green dots from different time frames very close together, that is a much stronger buy signal. If the MAC-D also agrees, well, it is very strong. This is shown as blue circle white arrow up.
Exit when you see a red cross or red arrow down, RSI overbought and MAC-D crossing down respectively.
You can use multi condition alerts, i.e. alert me to a STRONG BUY when 5 min VWAP crossed above while the 60 min is positive too, aaaand the MAC-D agrees.
Enjoy.
-Viral Killer
This is a script that contains 3 VWAP modes, 5 min, 60 min and 240 min timeframes, all on the same indicator. You add it to the 5 min chart, but seems to work on other ranges.
Usually, when the VWAP wave crosses above, it is a buy signal, although not perfect. This ensures there is also a MAC-D buy confirmation, for a much stronger buy signal.
You can setup SUPER alerts which ensure multiple time ranges line up, before alerting. Some are already built in.
Yellow Wave is 5 min VWAP , crossing from below into positive is a buy signal. Note the word signal, not guaranteed buy.
Orange Wave is 60 min VWAP , crossing from below into positive is a buy signal.
Purple Wave is 240 min VWAP , crossing from below into positive is a buy signal.
The blue wave is 5 the minutes RSI and the other lines are 1h/4h, corresponding to oversold and overbought signals.
U will see a trail of red and blue arrows on the MAC-D, this script knows when the MAC-D is losing power.
Green dots are a buy, dark dots are a sell. Green with orange rim is a weak buy.
If you see 2 or 3 green dots from different time frames very close together, that is a much stronger buy signal. If the MAC-D also agrees, well, it is very strong. This is shown as blue circle white arrow up.
Exit when you see a red cross or red arrow down, RSI overbought and MAC-D crossing down respectively.
You can use multi condition alerts, i.e. alert me to a STRONG BUY when 5 min VWAP crossed above while the 60 min is positive too, aaaand the MAC-D agrees.
Enjoy.
-Viral Killer
リリースノート
Finally super alerts should be working thanks to crossover/underリリースノート
Alerts workingリリースノート
alertsリリースノート
Shorts alerts fixed updatedリリースノート
Money flow addedリリースノート
alerts リリースノート
Moneyflow chartリリースノート
Amazing color changesリリースノート
better graphicsリリースノート
Improvementsリリースノート
alerts!リリースノート
latestリリースノート
alerts fixesリリースノート
visual adjustmentsリリースノート
color improvementsリリースノート
improved formulasリリースノート
OK these are the INSTRUCTIONS:ADD THE INDICATOR TO THE 5 MINUTES CHART. But it does work nicely on all other timeframes. The ratio is basically 1:12:48 (5 minutes/60 minutes/240 minutes). So if you added it to the 1 hour chart, the other two waves would be the 12 hour and 2 days (48 hours is 2 days).
Excuse the bad icons, I picked what was closest and available in the emoji options.
1) 🌀/🛑 = Large blue/red circles with white rims = Entry and exit points for the MACD 5 minutes. Very potent. If you see a green and blue close together, go LONG.
2) 🤢/🔴 = Standard green/red dots = VWAP entry and exit points. These are weak on their own, but combined with a MACD blue/red, can be much more potent. There are 3 sizes; 5m (blue waves), 1h (orange line, larger green/red dots), 4h (faint red line with the largest green/red dots).
3) 🌰 = Orange dots. These are buys, but in somewhat overbought conditions. Still, combined with a MACD blue, can be potents LONGS still.
4) The green/red WAVE. Money flow index, very powerful tool. If the moneyflow is green, LONGS are much more potent. If the moneyflow is red, especially the 4h, you probably want to short, regardless of all the green and blue dots. If moneyflow is green, and you see a green and blue dot cluster, this is a very positive LONG.
5) There is a hidden 1 hour and 4h MACD, which you can activate via the settings. These are hidden for UI purposes (can you handle even more waves?😉), but are used in the formulas.
6) SUPER and ULTRA alerts. These are cutting edge alerts, that only bother you when all 9 planets have lined up 😉. A SUPER alert requires the VWAP and MACD to line up and agree. An ULTRA alert requires the VWAP and MACD to line up and agree, PLUS moneyflow confirmation. The 4 hour ULTRA LONG is a big deal as this means that the 5m/1h/4h VWAPs are all positive, the moneyflow is green, and at least 1 MACD is pointing up too. Potent stuff. Saves you from watching loads of screens, just let Scalp King handle it for you.
Version 3.0 coming soon, with some incredible new features that make this simply the best FREE indicator here.
リリースノート
Ultimate alerts added, that require the 5m/1h MACD's to cross above/below for an extra signal boostリリースノート
Changed color of the 4 hour VWAP, so it doesn't clash with the red MFリリースノート
Efficiency fixesリリースノート
Loads more settings to control scales etc.You can now define your own 3 time-frames, regardless of which chart timeframe you are in. i.e. 1m/15m/45m.
There is now another (hidden) MAC-D 1h you can turn on.
リリースノート
Hidden 1h, 4h MACD, goto options to activateリリースノート
Money Flow 1hour code addedリリースノート
tweak a few algorithms to better match historic data保護スクリプト
このスクリプトのソースコードは非公開で投稿されています。 ただし、制限なく自由に使用できます – 詳細はこちらでご確認ください。
免責事項
この情報および投稿は、TradingViewが提供または推奨する金融、投資、トレード、その他のアドバイスや推奨を意図するものではなく、それらを構成するものでもありません。詳細は利用規約をご覧ください。
保護スクリプト
このスクリプトのソースコードは非公開で投稿されています。 ただし、制限なく自由に使用できます – 詳細はこちらでご確認ください。
免責事項
この情報および投稿は、TradingViewが提供または推奨する金融、投資、トレード、その他のアドバイスや推奨を意図するものではなく、それらを構成するものでもありません。詳細は利用規約をご覧ください。