PROTECTED SOURCE SCRIPT
Ultra High Volume Candles with Lines
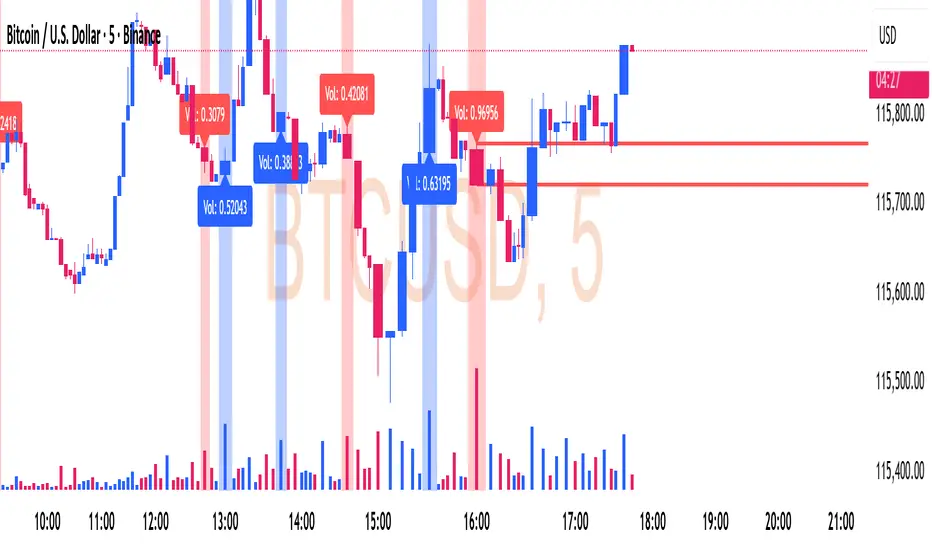
📊 Ultra High Volume (UHV) – Smart Money Alert 🚨
🔎 What is Ultra High Volume?
Ultra High Volume happens when a candle’s trading volume is much higher than the average volume of the last few bars.
👉 Example: If the average volume is 100k and suddenly a candle shows 300k → that’s Ultra High Volume.
It means big players (institutions, banks, funds) are active in that candle.
This is important because price moves strongly when big money participates.
🟥 Ultra High Volume Red Candle
When UHV appears on a red (bearish) candle:
🚩 It shows strong selling pressure.
📉 Can be a distribution phase (smart money unloading positions).
🛑 Often appears at resistance zones → possible trend reversal.
🎯 Sometimes it’s a stop-loss hunt before a reversal (fake push down).
🟦 Ultra High Volume Blue/Green Candle
When UHV appears on a blue/green (bullish) candle:
🚀 It shows strong buying pressure.
📈 Can be accumulation (smart money loading positions).
💥 Appears at breakout levels → signals continuation of the trend.
🛡️ Absorbs sellers before a big upward move.
⚖️ Why UHV is Important
UHV shows where smart money is active.
It tells us the market is at a decision point.
BUT ⚠️ → UHV doesn’t guarantee direction.
Always combine with:
✅ Market structure (higher highs, higher lows, CHoCH, BOS)
✅ Support & Resistance
✅ Order blocks and liquidity zones
📌 Example of Reading UHV
🔺 UHV at support → possible bounce (accumulation).
🔻 UHV at resistance → possible rejection (distribution).
💥 UHV during a breakout → confirms continuation.
❓ UHV in the middle of nowhere → usually a trap → avoid trading blindly.
💡 Key Takeaway
Volume = Fuel. Price moves with volume.
Ultra High Volume = Institutional footprint.
When you see it:
Don’t ignore 🚨
Look at the context (trend, structure, key zones)
Trade in sync with the big players
✨ UHV is not just a candle – it’s the market shouting at you: "Pay Attention!"
SETTINGS : Better result 4x volume candles
保護スクリプト
このスクリプトのソースコードは非公開で投稿されています。 ただし、制限なく自由に使用できます – 詳細はこちらでご確認ください。
免責事項
この情報および投稿は、TradingViewが提供または推奨する金融、投資、トレード、その他のアドバイスや推奨を意図するものではなく、それらを構成するものでもありません。詳細は利用規約をご覧ください。
保護スクリプト
このスクリプトのソースコードは非公開で投稿されています。 ただし、制限なく自由に使用できます – 詳細はこちらでご確認ください。
免責事項
この情報および投稿は、TradingViewが提供または推奨する金融、投資、トレード、その他のアドバイスや推奨を意図するものではなく、それらを構成するものでもありません。詳細は利用規約をご覧ください。