INVITE-ONLY SCRIPT
更新済 Price Sync Mapper+ [Pt]
█ Description:
Price Sync Mapper [Pt] is a robust TradingView indicator designed to plot correlated price levels of related assets onto the primary chart. This tool is particularly useful for traders who want to trade one asset while monitoring the price action and key levels on another correlated asset, such as leveraged ETFs, inverse ETFs, and other correlated trading pairs. By mapping the price levels of one asset onto another, traders can gain insights into relative price movements and potential trading opportunities.
█ Key Features:
► Multiple Asset Mapping: Supports mapping up to two different tickers onto the primary chart, each with customizable settings, including leverage and inverse properties.
► Dynamic Price Levels: Define the number of price levels to map based on the price movements of the correlated asset, with the scale defined by the multiplier setting.
► VWAP Integration: Option to display Volume Weighted Average Price (VWAP) lines for each mapped ticker, providing additional context on average trading prices. Users can also choose to smooth the VWAP line with a moving average.
► Custom Target Levels: Set and display custom price targets with detailed labels, allowing visualization of key price levels for trading strategies. Users can define labels, tickers, and offsets for up to 8 custom price targets.
► Flexible Update Frequency: Choose to update the indicator on every tick or at the close of each candle, providing flexibility based on trading style and preferences.
► Extended Hours Highlighting: Option to highlight extended trading hours sessions, helping to differentiate between regular and extended trading periods.
► Price Change Display: Displays the percentage price change for each mapped ticker, providing quick insights into the relative performance of correlated assets.
► Table Display: Option to show a table with the current prices, leverage factors, and percentage changes of the mapped tickers, enhancing overall usability and information accessibility. The table can be positioned at various locations on the chart and its font size can be customized.
█ Usage Examples:
► Example 1:
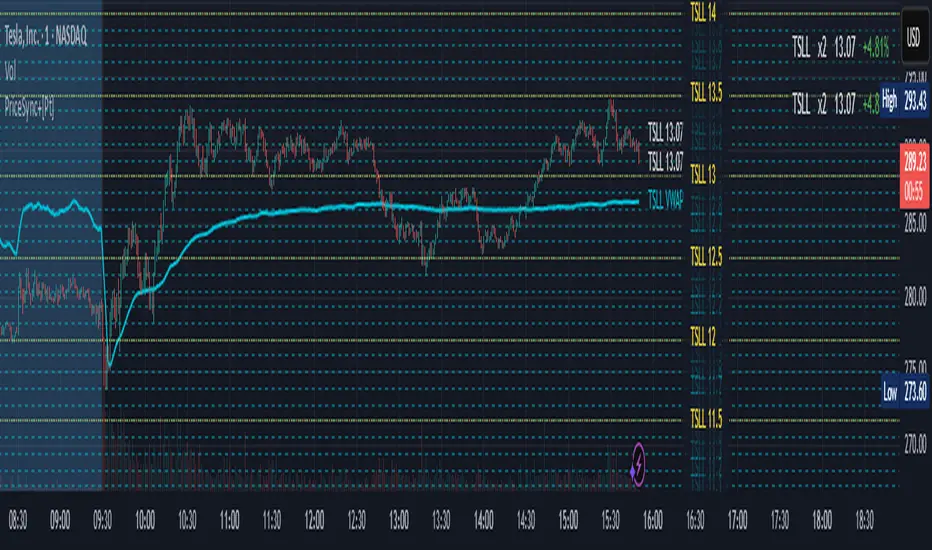
Map the price levels of the Direxion Daily TSLA Bull 2X Shares (TSLL) onto the primary chart of Tesla Inc. (TSLA). This allows traders to see how the leveraged ETF's price movements align with the underlying stock, providing insights into potential trading opportunities based on leverage effects.

► Example 2:
Trade ProShares UltraPro Short QQQ (SQQQ) price levels on Invesco QQQ Trust (QQQ). By mapping the inverse 3x leveraged ETF's price levels onto the underlying asset, traders can set their targets directly on the QQQ chart without flipping between charts and 'guess-timate' which level correspond to which level.

█ Cautionary Note:
Price mapping may not work properly during extended trading hours due to lack of price data, and different trading dynamics and volume.
Price Sync Mapper [Pt] is a robust TradingView indicator designed to plot correlated price levels of related assets onto the primary chart. This tool is particularly useful for traders who want to trade one asset while monitoring the price action and key levels on another correlated asset, such as leveraged ETFs, inverse ETFs, and other correlated trading pairs. By mapping the price levels of one asset onto another, traders can gain insights into relative price movements and potential trading opportunities.
█ Key Features:
► Multiple Asset Mapping: Supports mapping up to two different tickers onto the primary chart, each with customizable settings, including leverage and inverse properties.
► Dynamic Price Levels: Define the number of price levels to map based on the price movements of the correlated asset, with the scale defined by the multiplier setting.
► VWAP Integration: Option to display Volume Weighted Average Price (VWAP) lines for each mapped ticker, providing additional context on average trading prices. Users can also choose to smooth the VWAP line with a moving average.
► Custom Target Levels: Set and display custom price targets with detailed labels, allowing visualization of key price levels for trading strategies. Users can define labels, tickers, and offsets for up to 8 custom price targets.
► Flexible Update Frequency: Choose to update the indicator on every tick or at the close of each candle, providing flexibility based on trading style and preferences.
► Extended Hours Highlighting: Option to highlight extended trading hours sessions, helping to differentiate between regular and extended trading periods.
► Price Change Display: Displays the percentage price change for each mapped ticker, providing quick insights into the relative performance of correlated assets.
► Table Display: Option to show a table with the current prices, leverage factors, and percentage changes of the mapped tickers, enhancing overall usability and information accessibility. The table can be positioned at various locations on the chart and its font size can be customized.
█ Usage Examples:
► Example 1:
Map the price levels of the Direxion Daily TSLA Bull 2X Shares (TSLL) onto the primary chart of Tesla Inc. (TSLA). This allows traders to see how the leveraged ETF's price movements align with the underlying stock, providing insights into potential trading opportunities based on leverage effects.
► Example 2:
Trade ProShares UltraPro Short QQQ (SQQQ) price levels on Invesco QQQ Trust (QQQ). By mapping the inverse 3x leveraged ETF's price levels onto the underlying asset, traders can set their targets directly on the QQQ chart without flipping between charts and 'guess-timate' which level correspond to which level.
█ Cautionary Note:
Price mapping may not work properly during extended trading hours due to lack of price data, and different trading dynamics and volume.
リリースノート
Minor updates:◊ Added labels for VWAP lines
リリースノート
- Fixed Inverse option bug
- Fixed conversion line bug
リリースノート
Minor update:- converted price levels will round to multiples of multiplier
招待専用スクリプト
このスクリプトは作者が承認したユーザーのみアクセス可能です。使用するにはアクセス申請をして許可を得る必要があります。通常は支払い後に承認されます。詳細は下記の作者の指示に従うか、PtGamblerに直接お問い合わせください。
TradingViewは、作者を完全に信頼し、スクリプトの動作を理解していない限り、有料スクリプトの購入・使用を推奨しません。コミュニティスクリプトには無料のオープンソースの代替が多数あります。
作者の指示
DM or reach me through my channels.
Purchases / Subscriptions / Support - buymeacoffee.com/ptgambler
PayPal - paypal.me/PtGambler
You can reach me privately through my Discord Channel: discord.gg/WMQfaVGyQC
PayPal - paypal.me/PtGambler
You can reach me privately through my Discord Channel: discord.gg/WMQfaVGyQC
免責事項
この情報および投稿は、TradingViewが提供または推奨する金融、投資、トレード、その他のアドバイスや推奨を意図するものではなく、それらを構成するものでもありません。詳細は利用規約をご覧ください。