PROTECTED SOURCE SCRIPT
Possible Deviations | Session Fibs
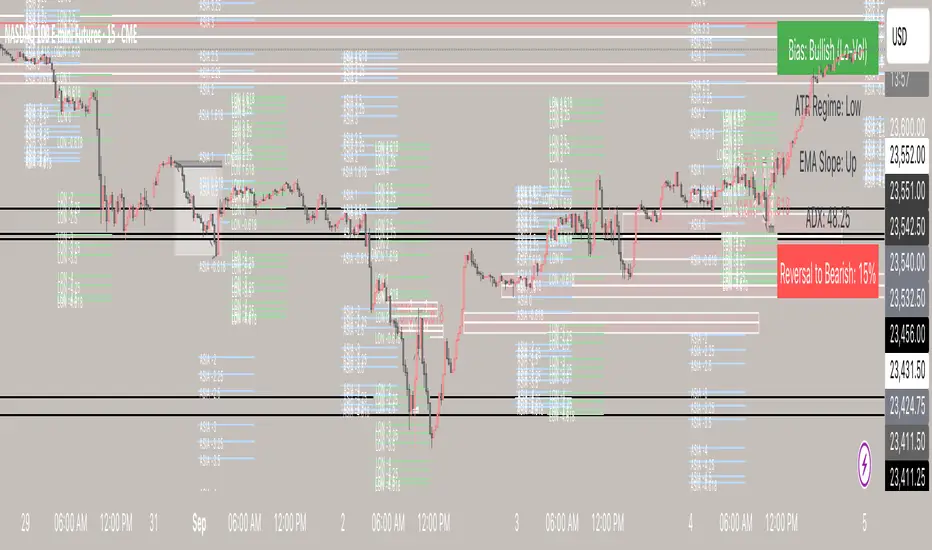
Session Fibs + Regime
A structured framework for intraday price action, designed to give traders both precision entry levels and a macro intraday bias filter in one indicator.
🔹 How It Works
1. Session Fibs
Automatically plots Fibonacci retracements and extensions from key session reference candles.
Levels expand across the chart, showing where liquidity often pools and where reversals or continuations have the highest probability.
Useful for identifying session-to-session ranges, breakout levels, and intraday inflection points.
2. Regime Analysis Table
Displays the current market environment in real time (e.g., trending, consolidating, or transitioning).
Derived from momentum, volatility, and directional bias — giving a clear snapshot of whether conditions favor continuation trades or mean-reversion setups.
Updates dynamically as price action evolves.
🔹 Why Use This Indicator?
Clarity at a glance – Instantly see the dominant regime without needing multiple extra tools.
Precision zones – Use Session Fibs to spot support/resistance clusters that align with institutional price behavior.
Contextual decision-making – Filter setups with the regime framework, reducing false signals and keeping you aligned with the market’s rhythm.
Intraday edge – Especially powerful on index futures, forex majors, and highly liquid equities where session structure matters.
🔹 Best Practices
Use on lower intraday timeframes (1m–15m) to track evolving structure.
Combine with higher timeframe bias (daily/weekly) for confluence.
Watch for fib level + regime alignment (e.g., a retracement to 61.8% inside a trending regime) as high-probability setups.
🔹 Who It’s For
This tool is designed for serious intraday traders who want:
More discipline and structure in their trading.
A way to avoid overtrading in choppy regimes.
Confidence in identifying where and when to engage the market.
⚡ Bottom line: The Session Fibs + Regime indicator doesn’t just give you levels — it gives you market context. It’s both a map of high-value price zones and a real-time bias filter that adapts as conditions change.
保護スクリプト
このスクリプトのソースコードは非公開で投稿されています。 ただし、制限なく自由に使用できます – 詳細はこちらでご確認ください。
免責事項
この情報および投稿は、TradingViewが提供または推奨する金融、投資、トレード、その他のアドバイスや推奨を意図するものではなく、それらを構成するものでもありません。詳細は利用規約をご覧ください。
免責事項
この情報および投稿は、TradingViewが提供または推奨する金融、投資、トレード、その他のアドバイスや推奨を意図するものではなく、それらを構成するものでもありません。詳細は利用規約をご覧ください。