PROTECTED SOURCE SCRIPT
Trend Dashboard
Trend Dashboard Indicator
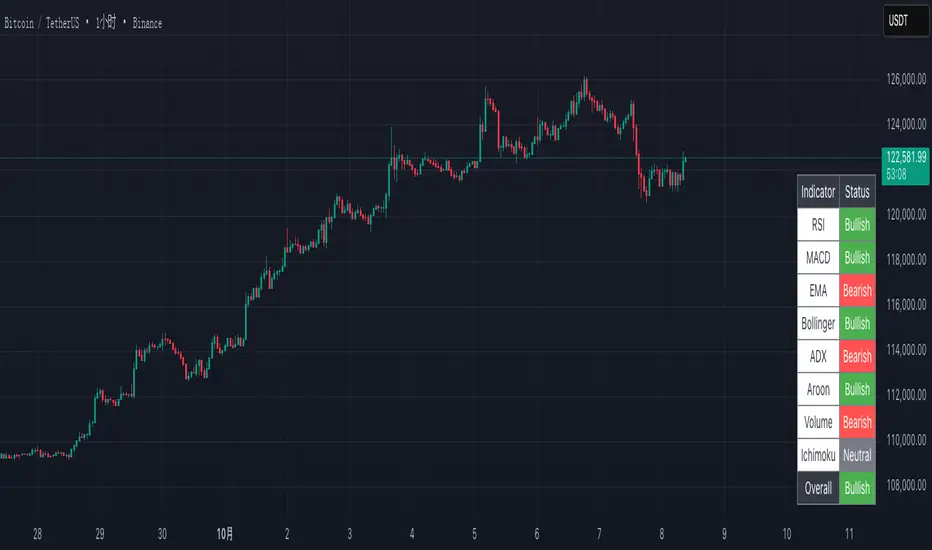
The Trend Dashboard is a custom TradingView Pine Script v5 indicator designed to provide a comprehensive analysis of Bitcoin (BTCUSD) market trends across multiple timeframes. It evaluates eight popular technical indicators—RSI, MACD, EMA, Bollinger Bands, ADX, Aroon, Volume, and Ichimoku Cloud—and displays their bullish, bearish, or neutral status in a clear, color-coded table in the bottom-right corner of the chart. Additionally, it calculates an overall trend assessment based on the collective signals of these indicators, making it a valuable tool for traders seeking a quick, at-a-glance view of market conditions.
The Trend Dashboard is a custom TradingView Pine Script v5 indicator designed to provide a comprehensive analysis of Bitcoin (BTCUSD) market trends across multiple timeframes. It evaluates eight popular technical indicators—RSI, MACD, EMA, Bollinger Bands, ADX, Aroon, Volume, and Ichimoku Cloud—and displays their bullish, bearish, or neutral status in a clear, color-coded table in the bottom-right corner of the chart. Additionally, it calculates an overall trend assessment based on the collective signals of these indicators, making it a valuable tool for traders seeking a quick, at-a-glance view of market conditions.
保護スクリプト
このスクリプトのソースコードは非公開で投稿されています。 しかし、無料かつ制限なしでご利用いただけます ― 詳細についてはこちらをご覧ください。
免責事項
これらの情報および投稿は、TradingViewが提供または保証する金融、投資、取引、またはその他の種類のアドバイスや推奨を意図したものではなく、またそのようなものでもありません。詳しくは利用規約をご覧ください。
免責事項
これらの情報および投稿は、TradingViewが提供または保証する金融、投資、取引、またはその他の種類のアドバイスや推奨を意図したものではなく、またそのようなものでもありません。詳しくは利用規約をご覧ください。