INVITE-ONLY SCRIPT
更新済 Ghost Vision III
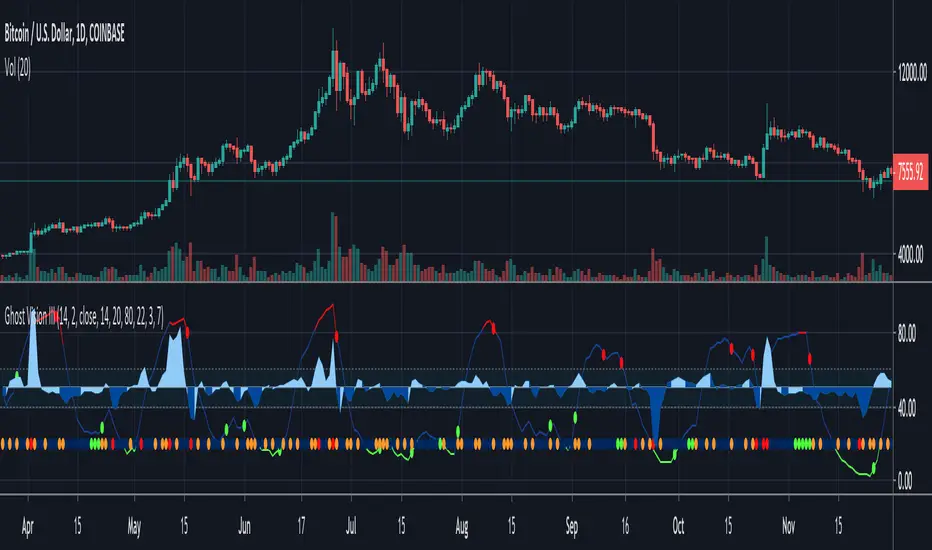
Green, red and blue lines can be over or under the baseline indicates oversold or overbought periods, green or red mountains are meant to explain price and volume momentum direction & strength. Dots are for market heat green is for less activity than normal blue for low activity, orange for a medium activity and red for high activity.
GhostVision III — Will answer you for the following questions:
Should I take a profit now?
The level amount of volume and price action?
Oversold or overbought?
Is it a pullback?
Can be used to:
Spot price moves that going to explode
Taking profit on extreme price movement
Spot fake price movements
Find pullback opportunities
Confirmations for GhostVision I & II
リリースノート
Easier to use colors layout "Iceberg"リリースノート
Price Strength Line Improvements:- Easier to use & see when and why we are overbought or oversold
- Double confirmation by line color and a dot (NEW)
For GhostVision Members:
Use it for a pullback strategy as an extra iceberg confirmation
リリースノート
Reduce dots size招待専用スクリプト
このスクリプトは作者が承認したユーザーのみアクセス可能です。使用するにはアクセス申請をして許可を得る必要があります。通常は支払い後に承認されます。詳細は下記の作者の指示に従うか、GhostVisionに直接お問い合わせください。
TradingViewは、作者を完全に信頼し、スクリプトの動作を理解していない限り、有料スクリプトの購入・使用を推奨しません。コミュニティスクリプトには無料のオープンソースの代替が多数あります。
作者の指示
免責事項
この情報および投稿は、TradingViewが提供または推奨する金融、投資、トレード、その他のアドバイスや推奨を意図するものではなく、それらを構成するものでもありません。詳細は利用規約をご覧ください。
招待専用スクリプト
このスクリプトは作者が承認したユーザーのみアクセス可能です。使用するにはアクセス申請をして許可を得る必要があります。通常は支払い後に承認されます。詳細は下記の作者の指示に従うか、GhostVisionに直接お問い合わせください。
TradingViewは、作者を完全に信頼し、スクリプトの動作を理解していない限り、有料スクリプトの購入・使用を推奨しません。コミュニティスクリプトには無料のオープンソースの代替が多数あります。
作者の指示
免責事項
この情報および投稿は、TradingViewが提供または推奨する金融、投資、トレード、その他のアドバイスや推奨を意図するものではなく、それらを構成するものでもありません。詳細は利用規約をご覧ください。