PROTECTED SOURCE SCRIPT
HMA High/Low Band - Trend Color
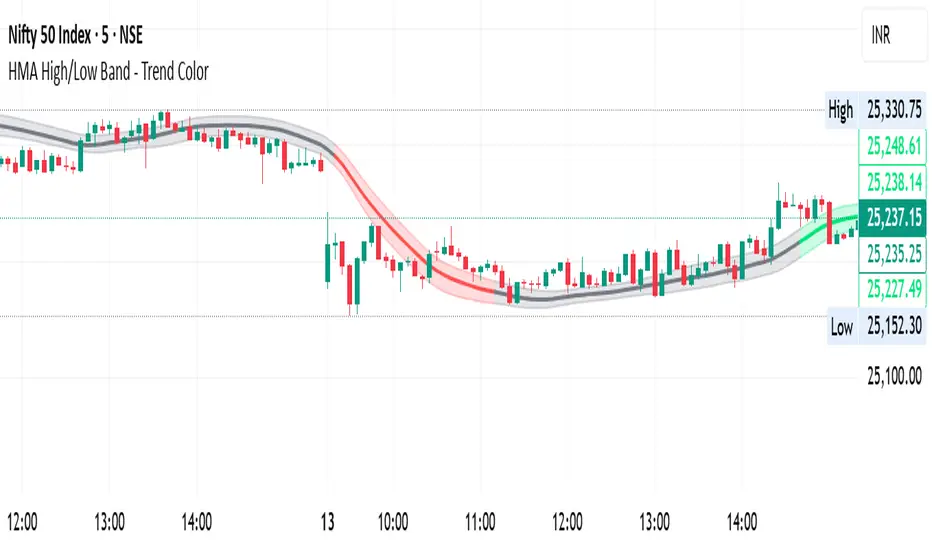
HMA High/Low Band Trend
Visualize market trends clearly with a single Hull Moving Average (HMA) and dynamic high/low bands. The indicator colors the HMA and its bands based on trend direction:
Green = Uptrend
Red = Downtrend
Gray = Sideways
The band adjusts dynamically to price action, giving a clear view of trending and sideways markets without cluttering your chart. Ideal for traders who want a smooth trend filter with instant visual cues.
保護スクリプト
このスクリプトのソースコードは非公開で投稿されています。 しかし、無料かつ制限なしでご利用いただけます ― 詳細についてはこちらをご覧ください。
免責事項
これらの情報および投稿は、TradingViewが提供または保証する金融、投資、取引、またはその他の種類のアドバイスや推奨を意図したものではなく、またそのようなものでもありません。詳しくは利用規約をご覧ください。
保護スクリプト
このスクリプトのソースコードは非公開で投稿されています。 しかし、無料かつ制限なしでご利用いただけます ― 詳細についてはこちらをご覧ください。
免責事項
これらの情報および投稿は、TradingViewが提供または保証する金融、投資、取引、またはその他の種類のアドバイスや推奨を意図したものではなく、またそのようなものでもありません。詳しくは利用規約をご覧ください。