PROTECTED SOURCE SCRIPT
更新済 Trading Signals
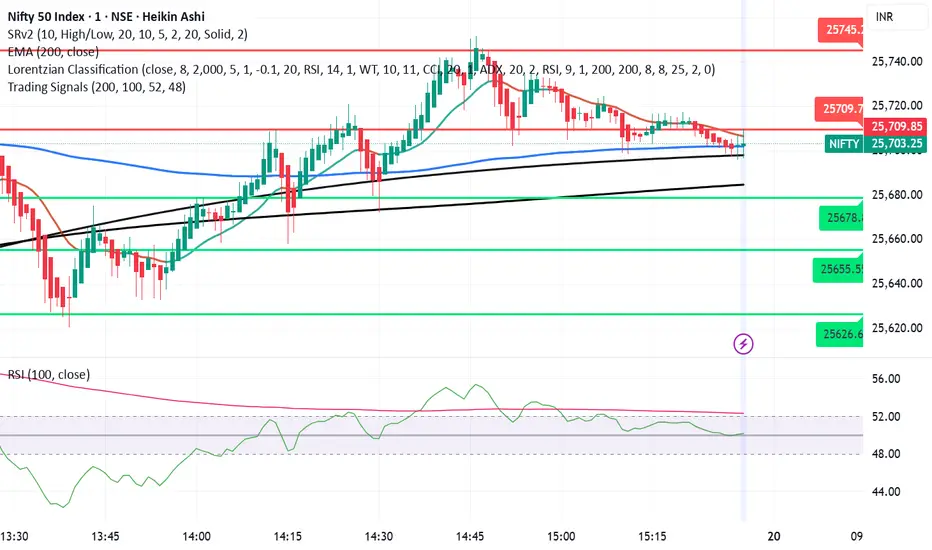
This script is designed to help identify high-probability trend reversal and continuation signals by combining moving average crossovers with momentum confirmation.
✨ How It Works:
EMA 200 — plots the 200-period Exponential Moving Average (EMA) of the closing price.
EMA-based SMA 200 — applies a 200-period Simple Moving Average (SMA) on top of the EMA values for smoother trend tracking.
Relative Strength Index (RSI) (Length 100) is used as a momentum filter to avoid false signals.
🟢 Buy Signal Conditions:
EMA 200 crosses above the EMA-based SMA 200.
RSI (100) is greater than 52, confirming bullish momentum.
🔴 Sell Signal Conditions:
EMA 200 crosses below the EMA-based SMA 200.
RSI (100) is less than 48, confirming bearish momentum.
リリースノート
This script is designed to help identify high-probability trend reversal and continuation signals by combining moving average crossovers with momentum confirmation.✨ How It Works:
EMA 200 — plots the 200-period Exponential Moving Average (EMA) of the closing price.
EMA-based SMA 200 — applies a 200-period Simple Moving Average (SMA) on top of the EMA values for smoother trend tracking.
Relative Strength Index (RSI) (Length 100) is used as a momentum filter to avoid false signals.
🟢 Buy Signal Conditions:
EMA 200 crosses above the EMA-based SMA 200.
🔴 Sell Signal Conditions:
EMA 200 crosses below the EMA-based SMA 200.
保護スクリプト
このスクリプトのソースコードは非公開で投稿されています。 ただし、制限なく自由に使用できます – 詳細はこちらでご確認ください。
免責事項
この情報および投稿は、TradingViewが提供または推奨する金融、投資、トレード、その他のアドバイスや推奨を意図するものではなく、それらを構成するものでもありません。詳細は利用規約をご覧ください。
保護スクリプト
このスクリプトのソースコードは非公開で投稿されています。 ただし、制限なく自由に使用できます – 詳細はこちらでご確認ください。
免責事項
この情報および投稿は、TradingViewが提供または推奨する金融、投資、トレード、その他のアドバイスや推奨を意図するものではなく、それらを構成するものでもありません。詳細は利用規約をご覧ください。