INVITE-ONLY SCRIPT
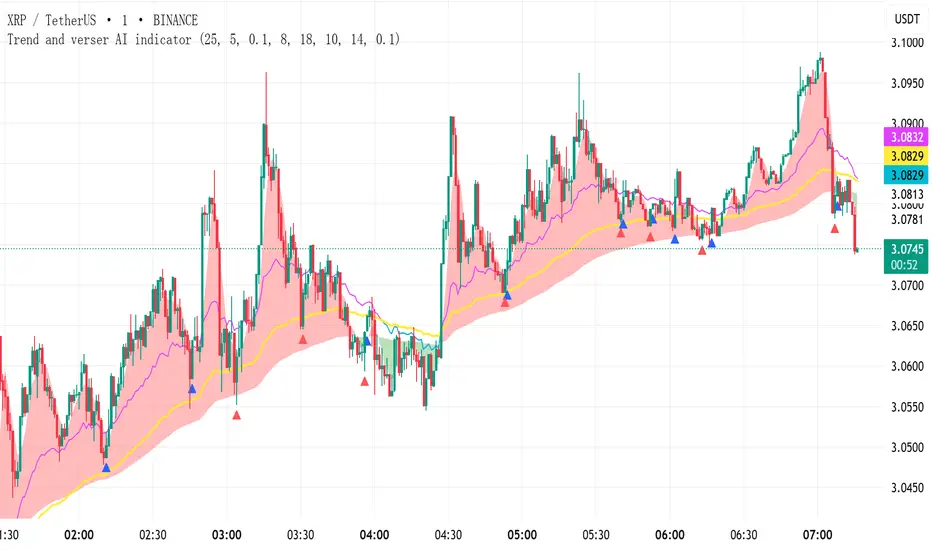
Trend and verser AI indicator V1.01
Declaration: NO REPAINTING, NO LAG, NO DISPLACEMENT – SIGNALS NEVER DISAPPEAR!
Indicator Usage Guide (Simple & Effective):
(1) Red Zone + UP Arrow → Go LONG
(2) Green Zone + DOWN Arrow → Go SHORT
(3) Alternating Red/Green Zones → Consolidation Phase (NO TRADING!)
Default parameters are optimized for reliable signals but can be customized as needed.
Instructions:
(1) This indicator is suitable for any trading instrument (stocks, futures, forex, cryptocurrencies, options, etc.) and any timeframe (minutes, hours, days, weeks, months).
(2) The indicator only provides entry signals (buy/sell signals). It does not provide exit signals. Profitability depends entirely on your holding period. This indicator does not guarantee profits.
(3) Arrows come in Red and Blue, representing two different signal types. Red signals may provide more precise reversal points on the candlestick chart compared to Blue signals.
(4) The indicator plots three distinct trend lines: a Red trend line, a Green trend line, and a Yellow trend line.
(5) * When the Red trend line is ABOVE the Yellow trend line, it signifies a Bullish (uptrend) market,consider taking LONG positions based on arrow signals.
* When the Green trend line is BELOW the Yellow trend line, it signifies a Bearish (downtrend) market,consider taking SHORT positions based on arrow signals.
* When the Red and Green trend lines are ALTERNATING (crossing frequently), it signifies a Ranging (sideways/consolidation) market, arrow signals are less reliable during this phase, and trading is NOT recommended.
招待専用スクリプト
このスクリプトは作者が承認したユーザーのみアクセス可能です。使用するにはアクセス申請をして許可を得る必要があります。通常は支払い後に承認されます。詳細は下記の作者の指示に従うか、zhushanshaoに直接お問い合わせください。
TradingViewは、作者を完全に信頼し、スクリプトの動作を理解していない限り、有料スクリプトの購入・使用を推奨しません。コミュニティスクリプトには無料のオープンソースの代替が多数あります。
作者の指示
Buyers please leave a message.
免責事項
この情報および投稿は、TradingViewが提供または推奨する金融、投資、トレード、その他のアドバイスや推奨を意図するものではなく、それらを構成するものでもありません。詳細は利用規約をご覧ください。