PROTECTED SOURCE SCRIPT
SPX Bull Market, Bear market and Corrections Since 1929
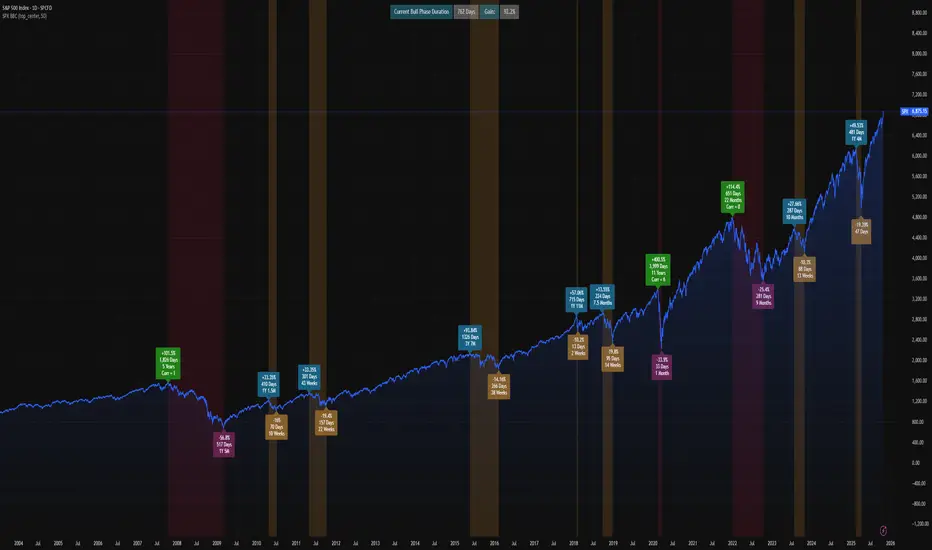
This script show visually with labels all the BULL & BEAR Market since 1929 with intermediary corrections.
Bear Market = Price drop of >=20% (based on closing price not intra day low)
Corrections = Price drop of >=10% and < 20% (based on closing price not intra day low, in intraday price it may go beyond 20% but closes in less than 20% )
The script doesn't update as we move forward , I need to manually update during every correction/bull/bear phases.
It is a good visual to study the past bull and bear market to gain some key insights!
保護スクリプト
このスクリプトのソースコードは非公開で投稿されています。 ただし、制限なく自由に使用できます – 詳細はこちらでご確認ください。
免責事項
この情報および投稿は、TradingViewが提供または推奨する金融、投資、トレード、その他のアドバイスや推奨を意図するものではなく、それらを構成するものでもありません。詳細は利用規約をご覧ください。
保護スクリプト
このスクリプトのソースコードは非公開で投稿されています。 ただし、制限なく自由に使用できます – 詳細はこちらでご確認ください。
免責事項
この情報および投稿は、TradingViewが提供または推奨する金融、投資、トレード、その他のアドバイスや推奨を意図するものではなく、それらを構成するものでもありません。詳細は利用規約をご覧ください。