INVITE-ONLY SCRIPT
更新済 HTF Multi-Asset Sync Display Pro
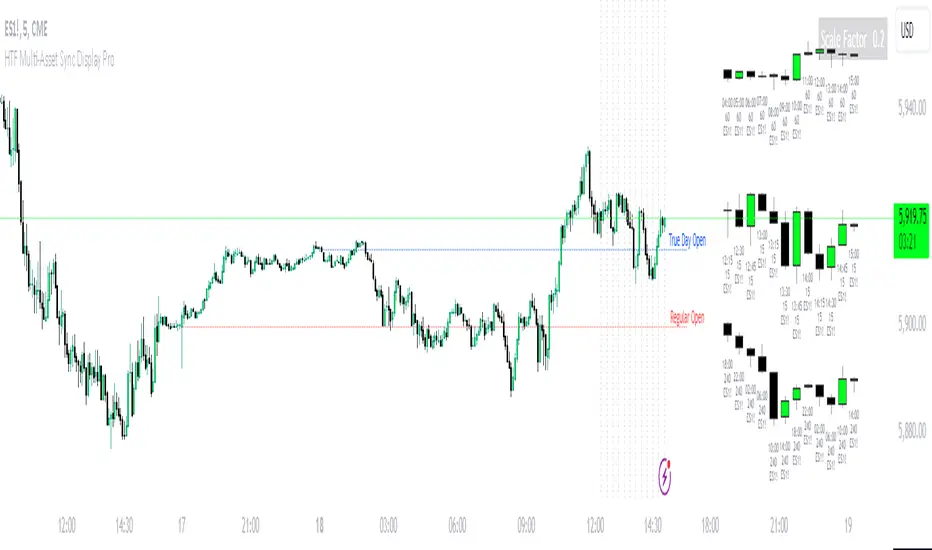
HTF Multi-Asset Sync Display Pro
A professional-grade indicator designed for advanced multi-timeframe and multi-symbol analysis. This powerful tool enables synchronized visualization of up to three different assets across various timeframes, making it perfect for correlation analysis, market structure comparison, and smart money tracking.
Overview
HTF Multi-Asset Sync Display Pro is an advanced visualization tool that allows traders to monitor up to three different symbols simultaneously on a single chart. Whether you're analyzing correlations, divergences, or inter-market relationships, this indicator provides a comprehensive solution for complex market analysis.
Usage Examples
1. Multi-Timeframe Analysis of Single Symbol
Perfect for traders focusing on market structure and order flow:
- Configure all three sets to display different higher timeframes of the chart's main symbol
- Example: On 5M chart, display 15M, 1H, and 4H timeframes

Benefits:
- Clear visualization of higher timeframe market structure
- Real-time order flow analysis across multiple timeframes
- Better context for ICT PD Arrays on higher timeframes
- Enhanced understanding of support/resistance levels
- Improved timing for entries and exits
2. Correlated Assets Analysis
Ideal for traders working with related instruments:
- Display higher timeframes of correlated assets (e.g., ES, NQ, and YM)

Benefits:
- Easy identification of divergences between correlated symbols
- Enhanced probability assessment for CRT setups
- Improved Turtle Soup trading opportunities
- Clear visualization of relative strength/weakness
- Better timing for market reversals
3. Extended Analysis with Multiple Indicators
Advanced setup for comprehensive market analysis:
- Use two instances of the indicator to display up to 6 different HTF sets
- Synchronization capabilities ensure precise alignment between indicators

Benefits:
- Extended market coverage with up to 6 HTF sets
- Perfect synchronization between indicator instances
- Comprehensive view of market structure
- Enhanced correlation analysis capabilities
- Maximum flexibility in timeframe selection
Note: The ability to combine multiple instances of the indicator, each showing three HTF sets, provides traders with unprecedented analytical capabilities while maintaining perfect synchronization across all displayed timeframes.
Key Features
Multi-Symbol Display
- Display up to three different symbols simultaneously
- Up to 12 candles for each symbol
- Customizable colors and styles for each symbol
- Adjustable vertical offsets for optimal visual arrangement
- Flexible scale factor for precise price movement comparison
Comprehensive Timeframe Support
- Intraday: 1, 2, 3, 4, 5, 6, 10, 15, 30, 45, 60, 90, 120, 180, 240 minutes
- Daily: D, 2D
- Weekly: W, 2W
- Monthly: M
- Compatibility between all minutes timeframes for synchronization
Dual Synchronization Modes
Auto Mode
- Automatic alignment based on relative price levels
- Perfect for quick visual comparison
Manual Mode
- Precise synchronization based on candle closing times
- Ideal for detailed technical analysis
Session Markers
- Two configurable session lines (e.g., Regular Open and True Day Open)
- Adjustable line length, style, and color
- Flexible timezone support for global markets
Visual Customization
- Fully customizable candle appearance including wicks
- Optional vertical lines for better time orientation
- Scalability for optimal price movement comparison
- Professional labeling system
Trading Applications
Correlation Analysis
- Monitor relationships between currency pairs
- Analyze crypto/stock correlations
- Identify divergences between related instruments
- Track inter-market relationships
Smart Money Analysis
- Identify accumulation zones
- Detect manipulation phases
- Track distribution phases
- Analyze institutional levels
- Monitor smart money footprints
ICT Price Delivery (PD) Arrays Analysis
- Enhanced visualization for manual PD Arrays identification
- Clear display of higher timeframe price action
- Improved visibility of potential PD Array structures
- Better context for manual analysis
Visual aid for ICT concepts identification
- Helps traders manually spot potential Breaker Blocks and Order Blocks
- Clearer view for identifying Inefficient Price Points
- Better context for Fair Value Gaps analysis
- Enhanced visibility for Mitigation Points and Liquidity Voids detection
Note: This indicator provides enhanced visualization tools to support manual ICT analysis. It does not automatically detect or mark PD Arrays or other ICT concepts - it serves as a visual aid for traders who understand and manually apply ICT concepts in their analysis.
Market Structure Analysis
- Compare price structure across timeframes
- Identify key levels on multiple timeframes
- Analyze session breakouts and swings
- Track market structure shifts
Candle Range Theory (CRT)
- Compare candle ranges across timeframes
- Identify potential breakout/breakdown levels
- Analyze relationships between HTF and LTF candle ranges
- Recognize reversal points at HTF range extremes
Turtle Soup Strategy Enhancement
- Identify false breakouts
- Validate breakouts by comparing LTF momentum with HTF structure
- Precise entry and exit level determination
Trading Efficiency
Time Management
- All necessary information on one chart
- Eliminate timeframe switching
- Quick market condition analysis
- Enhanced trading efficiency
Decision Making
- Instant market structure overview
- Quick key level identification
- Efficient trade setup confirmation
- Better entry and exit timing
Note
For optimal results, we recommend starting by setting the Base Price Level to the approximate price level of the main symbol, then adjusting the vertical offsets of other symbols according to your preferences.
A professional-grade indicator designed for advanced multi-timeframe and multi-symbol analysis. This powerful tool enables synchronized visualization of up to three different assets across various timeframes, making it perfect for correlation analysis, market structure comparison, and smart money tracking.
Overview
HTF Multi-Asset Sync Display Pro is an advanced visualization tool that allows traders to monitor up to three different symbols simultaneously on a single chart. Whether you're analyzing correlations, divergences, or inter-market relationships, this indicator provides a comprehensive solution for complex market analysis.
Usage Examples
1. Multi-Timeframe Analysis of Single Symbol
Perfect for traders focusing on market structure and order flow:
- Configure all three sets to display different higher timeframes of the chart's main symbol
- Example: On 5M chart, display 15M, 1H, and 4H timeframes
Benefits:
- Clear visualization of higher timeframe market structure
- Real-time order flow analysis across multiple timeframes
- Better context for ICT PD Arrays on higher timeframes
- Enhanced understanding of support/resistance levels
- Improved timing for entries and exits
2. Correlated Assets Analysis
Ideal for traders working with related instruments:
- Display higher timeframes of correlated assets (e.g., ES, NQ, and YM)
Benefits:
- Easy identification of divergences between correlated symbols
- Enhanced probability assessment for CRT setups
- Improved Turtle Soup trading opportunities
- Clear visualization of relative strength/weakness
- Better timing for market reversals
3. Extended Analysis with Multiple Indicators
Advanced setup for comprehensive market analysis:
- Use two instances of the indicator to display up to 6 different HTF sets
- Synchronization capabilities ensure precise alignment between indicators
Benefits:
- Extended market coverage with up to 6 HTF sets
- Perfect synchronization between indicator instances
- Comprehensive view of market structure
- Enhanced correlation analysis capabilities
- Maximum flexibility in timeframe selection
Note: The ability to combine multiple instances of the indicator, each showing three HTF sets, provides traders with unprecedented analytical capabilities while maintaining perfect synchronization across all displayed timeframes.
Key Features
Multi-Symbol Display
- Display up to three different symbols simultaneously
- Up to 12 candles for each symbol
- Customizable colors and styles for each symbol
- Adjustable vertical offsets for optimal visual arrangement
- Flexible scale factor for precise price movement comparison
Comprehensive Timeframe Support
- Intraday: 1, 2, 3, 4, 5, 6, 10, 15, 30, 45, 60, 90, 120, 180, 240 minutes
- Daily: D, 2D
- Weekly: W, 2W
- Monthly: M
- Compatibility between all minutes timeframes for synchronization
Dual Synchronization Modes
Auto Mode
- Automatic alignment based on relative price levels
- Perfect for quick visual comparison
Manual Mode
- Precise synchronization based on candle closing times
- Ideal for detailed technical analysis
Session Markers
- Two configurable session lines (e.g., Regular Open and True Day Open)
- Adjustable line length, style, and color
- Flexible timezone support for global markets
Visual Customization
- Fully customizable candle appearance including wicks
- Optional vertical lines for better time orientation
- Scalability for optimal price movement comparison
- Professional labeling system
Trading Applications
Correlation Analysis
- Monitor relationships between currency pairs
- Analyze crypto/stock correlations
- Identify divergences between related instruments
- Track inter-market relationships
Smart Money Analysis
- Identify accumulation zones
- Detect manipulation phases
- Track distribution phases
- Analyze institutional levels
- Monitor smart money footprints
ICT Price Delivery (PD) Arrays Analysis
- Enhanced visualization for manual PD Arrays identification
- Clear display of higher timeframe price action
- Improved visibility of potential PD Array structures
- Better context for manual analysis
Visual aid for ICT concepts identification
- Helps traders manually spot potential Breaker Blocks and Order Blocks
- Clearer view for identifying Inefficient Price Points
- Better context for Fair Value Gaps analysis
- Enhanced visibility for Mitigation Points and Liquidity Voids detection
Note: This indicator provides enhanced visualization tools to support manual ICT analysis. It does not automatically detect or mark PD Arrays or other ICT concepts - it serves as a visual aid for traders who understand and manually apply ICT concepts in their analysis.
Market Structure Analysis
- Compare price structure across timeframes
- Identify key levels on multiple timeframes
- Analyze session breakouts and swings
- Track market structure shifts
Candle Range Theory (CRT)
- Compare candle ranges across timeframes
- Identify potential breakout/breakdown levels
- Analyze relationships between HTF and LTF candle ranges
- Recognize reversal points at HTF range extremes
Turtle Soup Strategy Enhancement
- Identify false breakouts
- Validate breakouts by comparing LTF momentum with HTF structure
- Precise entry and exit level determination
Trading Efficiency
Time Management
- All necessary information on one chart
- Eliminate timeframe switching
- Quick market condition analysis
- Enhanced trading efficiency
Decision Making
- Instant market structure overview
- Quick key level identification
- Efficient trade setup confirmation
- Better entry and exit timing
Note
For optimal results, we recommend starting by setting the Base Price Level to the approximate price level of the main symbol, then adjusting the vertical offsets of other symbols according to your preferences.
リリースノート
Minor update: Fixed the offset settings for set 2 and set 3.リリースノート
Minor change. Scale factor can now be adjusted in hundredths.招待専用スクリプト
このスクリプトは作者が承認したユーザーのみアクセス可能です。使用するにはアクセス申請をして許可を得る必要があります。通常は支払い後に承認されます。詳細は下記の作者の指示に従うか、CZtrading1976に直接お問い合わせください。
TradingViewは、作者を完全に信頼し、スクリプトの動作を理解していない限り、有料スクリプトの購入・使用を推奨しません。コミュニティスクリプトには無料のオープンソースの代替が多数あります。
作者の指示
Try before you buy!
- 2-week FREE trial available
- One-time payment via PayPal (no subscription)
- Lifetime access
Contact for trial/purchase:
- DM here on TradingView
- Email: czhawkeye@gmail.com
免責事項
この情報および投稿は、TradingViewが提供または推奨する金融、投資、トレード、その他のアドバイスや推奨を意図するものではなく、それらを構成するものでもありません。詳細は利用規約をご覧ください。
招待専用スクリプト
このスクリプトは作者が承認したユーザーのみアクセス可能です。使用するにはアクセス申請をして許可を得る必要があります。通常は支払い後に承認されます。詳細は下記の作者の指示に従うか、CZtrading1976に直接お問い合わせください。
TradingViewは、作者を完全に信頼し、スクリプトの動作を理解していない限り、有料スクリプトの購入・使用を推奨しません。コミュニティスクリプトには無料のオープンソースの代替が多数あります。
作者の指示
Try before you buy!
- 2-week FREE trial available
- One-time payment via PayPal (no subscription)
- Lifetime access
Contact for trial/purchase:
- DM here on TradingView
- Email: czhawkeye@gmail.com
免責事項
この情報および投稿は、TradingViewが提供または推奨する金融、投資、トレード、その他のアドバイスや推奨を意図するものではなく、それらを構成するものでもありません。詳細は利用規約をご覧ください。