PROTECTED SOURCE SCRIPT
更新済 Kitaec MADIV (MAp of DIVergences)
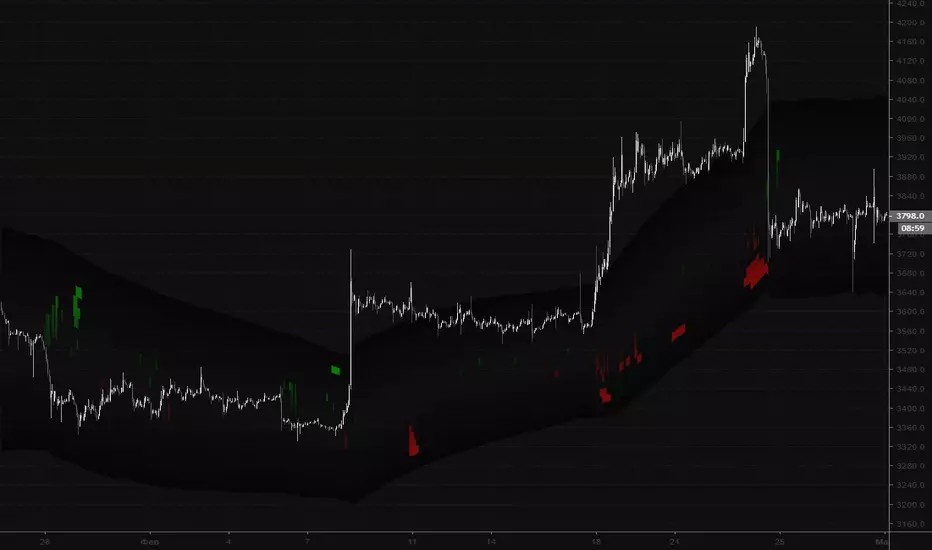
Map of RSI divergences part one. Must be used with MADIV2 (its a part 2 of this script). Showing Bullish and bearish divergences from different timeframes on the chart. Timeframes for full script are: 5m-15m-30m-1h-2h-4h-6h-8h-12h-1d. This part is from 5m to 2h. Second part is 4h-1d.
リリースノート
Map of RSI divergencies for 5m to 1D timeframes shown in a form of map. Updated to the PineScript v6.保護スクリプト
このスクリプトのソースコードは非公開で投稿されています。 ただし、制限なく自由に使用できます – 詳細はこちらでご確認ください。
免責事項
この情報および投稿は、TradingViewが提供または推奨する金融、投資、トレード、その他のアドバイスや推奨を意図するものではなく、それらを構成するものでもありません。詳細は利用規約をご覧ください。
免責事項
この情報および投稿は、TradingViewが提供または推奨する金融、投資、トレード、その他のアドバイスや推奨を意図するものではなく、それらを構成するものでもありません。詳細は利用規約をご覧ください。