OPEN-SOURCE SCRIPT
Volume change [ Unlimited ]
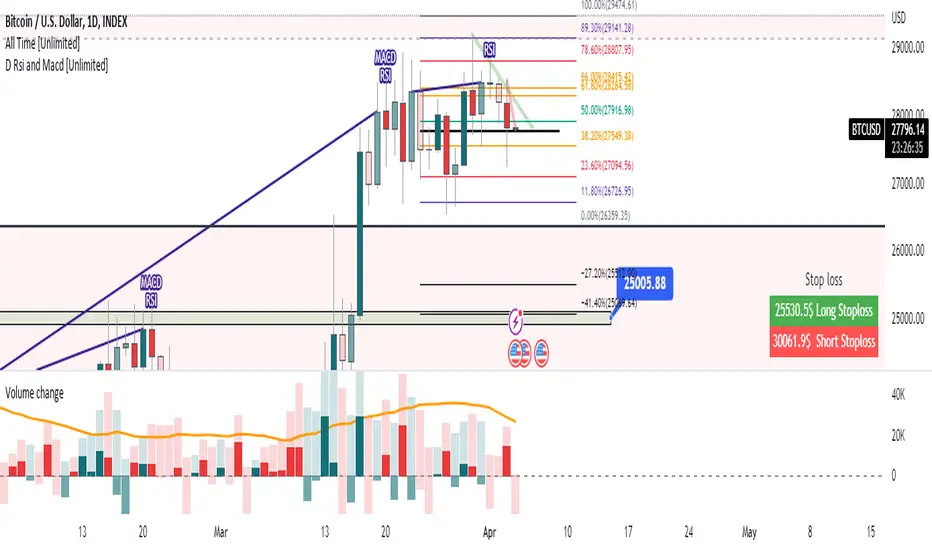
This indicator displays volume and volume change information on a chart. It is designed to help traders analyze changes in trading volume over time and identify potential trading opportunities.
The indicator takes an input from the user to set the length of the exponential moving average (EMA) applied to the volume data. This EMA is used to smooth out short-term fluctuations in volume and highlight the overall trend in volume.
The indicator calculates whether the current bar is up or down and calculates the change in volume. It then sets the color of the volume and volume change columns based on whether the bar is up or down and whether the volume change is positive or negative.
By displaying this information on a chart, the indicator can help traders identify patterns or trends in volume and volume change that may indicate potential trading opportunities. For example, increasing volume along with rising prices could indicate strong buying pressure and a potential bullish trend, while decreasing volume along with falling prices could indicate weak selling pressure and a potential bearish trend.
オープンソーススクリプト
TradingViewの精神に則り、このスクリプトの作者はコードをオープンソースとして公開してくれました。トレーダーが内容を確認・検証できるようにという配慮です。作者に拍手を送りましょう!無料で利用できますが、コードの再公開はハウスルールに従う必要があります。
免責事項
この情報および投稿は、TradingViewが提供または推奨する金融、投資、トレード、その他のアドバイスや推奨を意図するものではなく、それらを構成するものでもありません。詳細は利用規約をご覧ください。
オープンソーススクリプト
TradingViewの精神に則り、このスクリプトの作者はコードをオープンソースとして公開してくれました。トレーダーが内容を確認・検証できるようにという配慮です。作者に拍手を送りましょう!無料で利用できますが、コードの再公開はハウスルールに従う必要があります。
免責事項
この情報および投稿は、TradingViewが提供または推奨する金融、投資、トレード、その他のアドバイスや推奨を意図するものではなく、それらを構成するものでもありません。詳細は利用規約をご覧ください。