PROTECTED SOURCE SCRIPT
Stablecoin Ratio with TPI Score
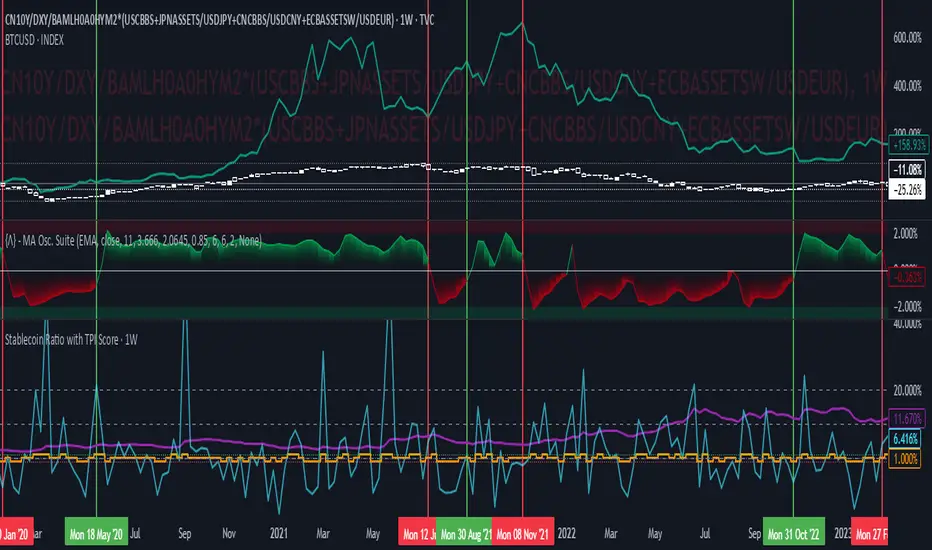
The script measures the stablecoin ratio (total stablecoin market cap divided by total crypto market cap, times 100) and its weekly change. Stablecoins (e.g., USDT, USDC) are a key gateway for capital entering or exiting the crypto ecosystem.
A rising ratio suggests more capital is parked in stablecoins (potential buying power), while a falling ratio indicates capital leaving (selling or withdrawal).
In a macro analysis, this is critical—it reflects the availability of liquid funds that could fuel price movements.
In macroeconomics, liquidity is a driver of asset prices.
In crypto, stablecoins represent sidelined capital ready to deploy.
How does it work?
Formula: (total_stablecoin_mcap / total_crypto_mcap) * 100.
Example: If stablecoins = $235B and total market cap = $2.5T, ratio = 9.4%.
Plotted as a red line in the oscillator pane, showing the percentage of the market held in stablecoins.
Calculates the percentage change in the ratio from the previous week:
(current_ratio - previous_ratio) / previous_ratio * 100.
Example: Ratio goes from 9% to 10% = +11.11% change.
*TPI Score Assignment:
+1 (Bullish): If the ratio increases by more than 5% week-over-week.
-1 (Bearish): If the ratio decreases by more than 5% week-over-week.
0 (Neutral): If the change is between -5% and +5%.
Plotted as orange step line bars in the oscillator pane, snapping to +1, 0, or -1.
A rising ratio suggests more capital is parked in stablecoins (potential buying power), while a falling ratio indicates capital leaving (selling or withdrawal).
In a macro analysis, this is critical—it reflects the availability of liquid funds that could fuel price movements.
In macroeconomics, liquidity is a driver of asset prices.
In crypto, stablecoins represent sidelined capital ready to deploy.
How does it work?
- Stablecoin Ratio:
Formula: (total_stablecoin_mcap / total_crypto_mcap) * 100.
Example: If stablecoins = $235B and total market cap = $2.5T, ratio = 9.4%.
Plotted as a red line in the oscillator pane, showing the percentage of the market held in stablecoins.
- Weekly Change:
Calculates the percentage change in the ratio from the previous week:
(current_ratio - previous_ratio) / previous_ratio * 100.
Example: Ratio goes from 9% to 10% = +11.11% change.
*TPI Score Assignment:
+1 (Bullish): If the ratio increases by more than 5% week-over-week.
-1 (Bearish): If the ratio decreases by more than 5% week-over-week.
0 (Neutral): If the change is between -5% and +5%.
Plotted as orange step line bars in the oscillator pane, snapping to +1, 0, or -1.
保護スクリプト
このスクリプトのソースコードは非公開で投稿されています。 ただし、制限なく自由に使用できます – 詳細はこちらでご確認ください。
免責事項
この情報および投稿は、TradingViewが提供または推奨する金融、投資、トレード、その他のアドバイスや推奨を意図するものではなく、それらを構成するものでもありません。詳細は利用規約をご覧ください。
免責事項
この情報および投稿は、TradingViewが提供または推奨する金融、投資、トレード、その他のアドバイスや推奨を意図するものではなく、それらを構成するものでもありません。詳細は利用規約をご覧ください。