PROTECTED SOURCE SCRIPT
Trend Band
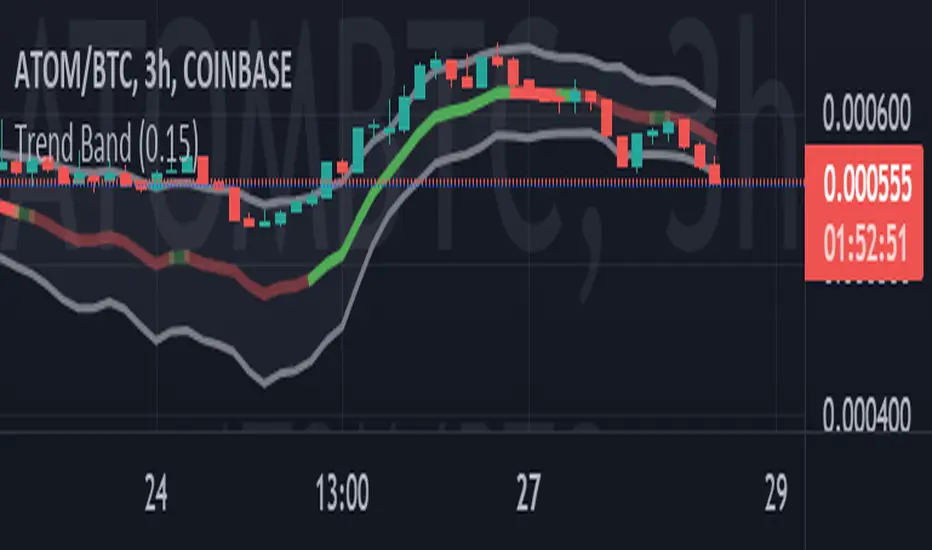
The volume-weighted, exponential running mean is computed. It is shown as the thick line. The plus-minus one standard deviation band is also shown with two thinner lines.
In contrast to other RAs, it is the trading volumes that are being processed here instead of the price itself.
For the averaging, the weight of the present relative to the past can be chosen by the user. It’s a number between 0 and 1. There are no other (hidden) parameters.
A price outside the band may be an indication that the security is overbought or oversold. It can also be an indication of a beginning trend. Disclaimer: No miracles!
Two alerts are included and act accordingly.
The color of the mean line comes from the derivative averaged the same way. The second derivative (reversals) is still to come.
保護スクリプト
このスクリプトのソースコードは非公開で投稿されています。 ただし、制限なく自由に使用できます – 詳細はこちらでご確認ください。
免責事項
この情報および投稿は、TradingViewが提供または推奨する金融、投資、トレード、その他のアドバイスや推奨を意図するものではなく、それらを構成するものでもありません。詳細は利用規約をご覧ください。
免責事項
この情報および投稿は、TradingViewが提供または推奨する金融、投資、トレード、その他のアドバイスや推奨を意図するものではなく、それらを構成するものでもありません。詳細は利用規約をご覧ください。