PROTECTED SOURCE SCRIPT
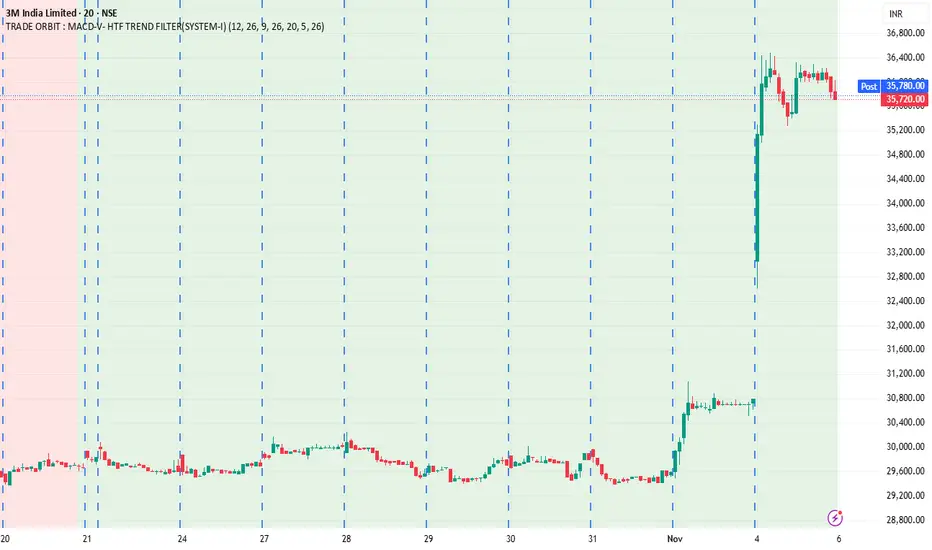
TRADE ORBIT : MACD-V- HTF TREND FILTER(SYSTEM-I)
✅ DESCRIPTION — TRADE ORBIT : MACD-V HTF TREND FILTER (SYSTEM-I)
This indicator is a multi-timeframe MACD-V based trend-filtering system designed to detect strong directional momentum using higher-timeframe confirmation and volatility conditions.
🔷 CORE CONCEPT
The script compares:
Current-TF MACD-V
4× Higher-TF MACD-V crossover signals
16× Higher-TF MACD-V background trend filter
ATR-based volatility confirmation
Only when momentum aligns and volatility is favorable will signals be considered valid.
🔷 COMPONENTS
✅ 1) MACD-V (Current Timeframe)
Uses EMA(12) − EMA(26) with signal EMA(9)
Indicates baseline market momentum
Plots two lines:
Yellow = MACD-V
White = Signal
Levels:
+50 → Strong bullish zone
0 → Neutral
−50 → Strong bearish zone
✅ 2) ATR (Current Timeframe)
ATR → measures volatility
ATR SMA → smoothing
Used visually only
✅ 3) Multi-TF Framework
The script calculates higher-timeframe equivalents by multiplying the current timeframe.
🔹 HTF-1 — 16× TF (Trend background)
Example:
Chart TF HTF-1
5m 80m
15m 240m
1h 16h
These values are mapped to the nearest valid TF:
(1, 3, 5, 15, 30, 45, 60, 120, 180, 240, 360, 720, D, W, M)
Purpose:
Defines macro-direction:
Green background → bullish MTF momentum
Red background → bearish MTF momentum
🔹 HTF-2 — 4× TF (Signal generation)
Example:
Chart TF HTF-2
5m 20m
15m 60m
1h 4h
Used for filtering MACD crosses.
保護スクリプト
このスクリプトのソースコードは非公開で投稿されています。 しかし、無料かつ制限なしでご利用いただけます ― 詳細についてはこちらをご覧ください。
免責事項
これらの情報および投稿は、TradingViewが提供または保証する金融、投資、取引、またはその他の種類のアドバイスや推奨を意図したものではなく、またそのようなものでもありません。詳しくは利用規約をご覧ください。
保護スクリプト
このスクリプトのソースコードは非公開で投稿されています。 しかし、無料かつ制限なしでご利用いただけます ― 詳細についてはこちらをご覧ください。
免責事項
これらの情報および投稿は、TradingViewが提供または保証する金融、投資、取引、またはその他の種類のアドバイスや推奨を意図したものではなく、またそのようなものでもありません。詳しくは利用規約をご覧ください。