INVITE-ONLY SCRIPT
ElectronixTrader - Multi-Timeframe S/R
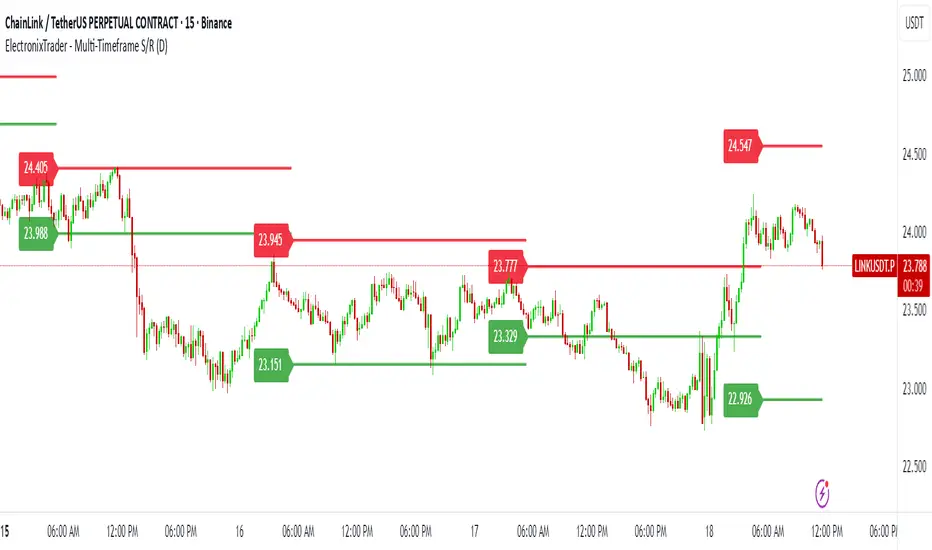
This script is a powerful multi-timeframe tool designed to help traders identify key support and resistance levels for both intraday and swing trading. It's a custom-built indicator that projects Bollinger Band levels from a higher timeframe onto your current chart, providing a unique perspective to filter out market noise and focus on high-probability trading zones.
The core principle is that significant price levels established on a daily or weekly chart can act as powerful support and resistance points on a lower, intraday timeframe. This helps traders align their entries and exits with the broader market context.
Key Features:
Dynamic Levels: The support and resistance lines are not static. They are automatically calculated and updated at the start of each new higher-timeframe candle, providing fresh and relevant levels.
Multi-Timeframe Capability: Easily switch the input timeframe (e.g., Daily to Weekly) to adapt the indicator for your trading style, from intraday to swing trading.
Disclaimer:
Trading involves significant risk, and past performance is not a guarantee of future results. This tool is for informational and educational purposes only and should be used in conjunction with your own risk management and trading plan.
A Note on Originality:
This indicator uses a unique application of built-in functions to project dynamic, higher-timeframe levels. While it is based on classic concepts, the specific methodology of projecting and consistently plotting these zones across different timeframes provides a unique and actionable tool for traders.
招待専用スクリプト
このスクリプトは作者が承認したユーザーのみアクセス可能です。使用するにはアクセス申請をして許可を得る必要があります。通常は支払い後に承認されます。詳細は下記の作者の指示に従うか、ElectronixTraderに直接お問い合わせください。
TradingViewは、作者を完全に信頼し、スクリプトの動作を理解していない限り、有料スクリプトの購入・使用を推奨しません。コミュニティスクリプトには無料のオープンソースの代替が多数あります。
作者の指示
"To request access to the Multi-Timeframe Support/Resistance script, please send me a private message on TradingView. I will respond as soon as possible with access details."
免責事項
この情報および投稿は、TradingViewが提供または推奨する金融、投資、トレード、その他のアドバイスや推奨を意図するものではなく、それらを構成するものでもありません。詳細は利用規約をご覧ください。