INVITE-ONLY SCRIPT
更新済 VBSMI with Dynamic Bands and MTF Screener by QTX Algo Systems
Volatility Based SMI with Dynamic Bands & MTF Screener by QTX Algo Systems
Overview
This enhanced version of the Volatility Based SMI with Dynamic Bands (VBSMI) expands on the original design by integrating a Multi-Timeframe (MTF) Screener. It maintains the core momentum detection and volatility-responsive adjustments of the standard VBSMI while providing expanded multi-timeframe analysis across multiple assets in a tabular format.
By allowing users to track momentum shifts, reversals, and trend conditions across multiple timeframes and multiple assets, this version enhances market awareness and helps traders make more informed decisions.
How It Works
Enhanced SMI Calculation
The core SMI calculation uses double smoothing through Exponential Moving Averages (EMAs) to refine price movements.
Inputs for Smoothing K and Smoothing D control how much noise is filtered.
A final SMI EMA is applied to help confirm momentum direction.
Adaptive Volatility Scaling
A fixed Bollinger Band Width Percentile (BBWP) calculation is used to create an Adaptive Adjustment Factor for the SMI.
This ensures the oscillator adapts to current volatility levels, making signals more context-aware.
Dynamic Threshold Adjustment
The overbought and oversold thresholds (default 50 and -50) adjust in real time based on market conditions.
These adjustments use three proprietary factors:
Trend Lookback Period – Determines historical trend strength using a VWMA-based comparison.
Upper & Lower Band Tilt Strength – Controls how aggressively the bands shift in response to trends.
Opposite Band Compression – Adjusts the speed of threshold contraction when trends reverse, making it more responsive.
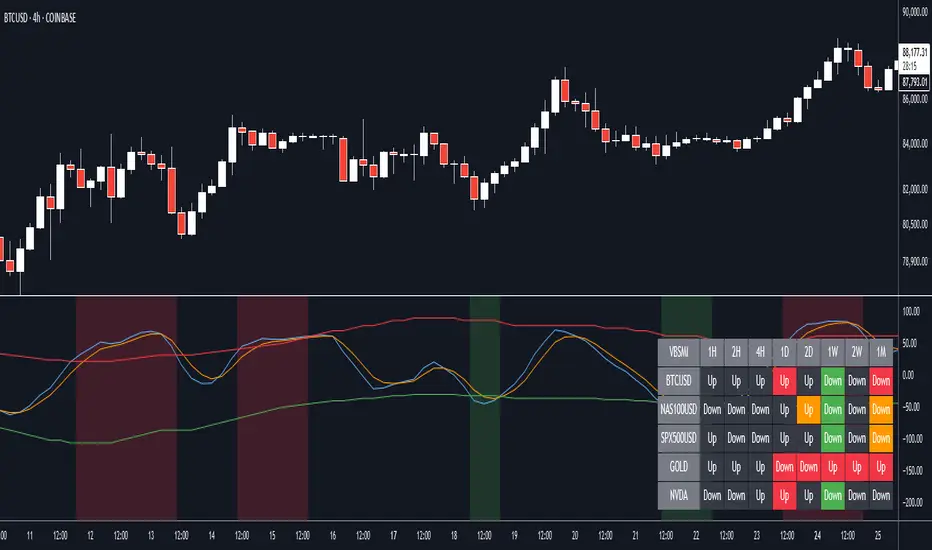
Multi-Timeframe and Multi-Asset Screener (MTF) – New Feature
The integrated MTF Screener provides a real-time overview of the VBSMI's conditions across multiple timeframes and assets.
It includes:
✅ User-selectable timeframes (Default: 1H, 4H, 1D, 3D, 1W, 1M).
✅ Up to 6 additional tickers for multi-asset analysis.
✅ Real-time VBSMI color-coded conditions for easier signal interpretation.
How to Read the MTF Screener Table
Each cell in the table provides a momentum reading based on VBSMI conditions in different timeframes:
🟢 Green Background → Oversold Condition (Potential Buy Zone)
🔴 Red Background → Overbought Condition (Potential Sell Zone)
📊 Label: "Up" or "Down" → Shows whether VBSMI is above or below its EMA.
🟠 Orange Background → VBSMI crossovers from oversold/overbought conditions
How to Use & Adjust Inputs
Momentum Confirmation & Reversals
Use the dynamically adjusting thresholds to confirm when momentum is overextended or entering a new trend phase.
Monitor crossovers between the SMI and its EMA—these can be potential reversal or trend continuation signals.
Multi-Timeframe Trend Confirmation
Look for alignment across multiple timeframes in the MTF Screener (e.g., if the 1H, 4H, and 1D all show green, it strengthens a bullish case).
Use the multi-ticker feature to see how different assets align with your primary asset’s momentum signals.
Fine-Tuning the Inputs
Smoothing K & D: Controls how much the SMI is smoothed. Lower values make the indicator respond faster but can introduce noise, while higher values produce smoother signals with a slight delay.
SMI EMA Length: Adjusts the sensitivity of the exponential moving average applied to the SMI. A lower value makes the EMA react more quickly, while a higher value slows it down for more stable signals.
Trend Lookback Period: Defines how far back the indicator looks to assess trend strength. A shorter lookback makes it more reactive to recent price movements, while a longer period smooths out fluctuations for a broader trend perspective.
Band Tilt Strengths: Determines how much the overbought and oversold levels shift in response to market trends. Increasing this value causes the thresholds to adjust more aggressively, making the indicator more sensitive to trend direction.
Opposite Band Compression: Controls how quickly the opposite band contracts when a trend reversal occurs. A higher value results in faster compression, making the indicator more responsive to sudden market shifts.
What Makes This Unique?
Unlike traditional Stochastic Momentum Index (SMI) indicators, which rely on fixed overbought/oversold levels, this version:
✔ Adjusts the SMI based on relevant volatility
✔ Adapts thresholds based on volatility & trend strength
✔ Incorporates multi-timeframe screening for trend confirmation
✔ Uses an MTF table for real-time, multi-asset tracking
Disclaimer
This indicator is for educational purposes only and is meant to support trading strategies—not replace independent analysis.
No financial guarantees are provided. Past performance does not guarantee future results. Always use proper risk management.
Overview
This enhanced version of the Volatility Based SMI with Dynamic Bands (VBSMI) expands on the original design by integrating a Multi-Timeframe (MTF) Screener. It maintains the core momentum detection and volatility-responsive adjustments of the standard VBSMI while providing expanded multi-timeframe analysis across multiple assets in a tabular format.
By allowing users to track momentum shifts, reversals, and trend conditions across multiple timeframes and multiple assets, this version enhances market awareness and helps traders make more informed decisions.
How It Works
Enhanced SMI Calculation
The core SMI calculation uses double smoothing through Exponential Moving Averages (EMAs) to refine price movements.
Inputs for Smoothing K and Smoothing D control how much noise is filtered.
A final SMI EMA is applied to help confirm momentum direction.
Adaptive Volatility Scaling
A fixed Bollinger Band Width Percentile (BBWP) calculation is used to create an Adaptive Adjustment Factor for the SMI.
This ensures the oscillator adapts to current volatility levels, making signals more context-aware.
Dynamic Threshold Adjustment
The overbought and oversold thresholds (default 50 and -50) adjust in real time based on market conditions.
These adjustments use three proprietary factors:
Trend Lookback Period – Determines historical trend strength using a VWMA-based comparison.
Upper & Lower Band Tilt Strength – Controls how aggressively the bands shift in response to trends.
Opposite Band Compression – Adjusts the speed of threshold contraction when trends reverse, making it more responsive.
Multi-Timeframe and Multi-Asset Screener (MTF) – New Feature
The integrated MTF Screener provides a real-time overview of the VBSMI's conditions across multiple timeframes and assets.
It includes:
✅ User-selectable timeframes (Default: 1H, 4H, 1D, 3D, 1W, 1M).
✅ Up to 6 additional tickers for multi-asset analysis.
✅ Real-time VBSMI color-coded conditions for easier signal interpretation.
How to Read the MTF Screener Table
Each cell in the table provides a momentum reading based on VBSMI conditions in different timeframes:
🟢 Green Background → Oversold Condition (Potential Buy Zone)
🔴 Red Background → Overbought Condition (Potential Sell Zone)
📊 Label: "Up" or "Down" → Shows whether VBSMI is above or below its EMA.
🟠 Orange Background → VBSMI crossovers from oversold/overbought conditions
How to Use & Adjust Inputs
Momentum Confirmation & Reversals
Use the dynamically adjusting thresholds to confirm when momentum is overextended or entering a new trend phase.
Monitor crossovers between the SMI and its EMA—these can be potential reversal or trend continuation signals.
Multi-Timeframe Trend Confirmation
Look for alignment across multiple timeframes in the MTF Screener (e.g., if the 1H, 4H, and 1D all show green, it strengthens a bullish case).
Use the multi-ticker feature to see how different assets align with your primary asset’s momentum signals.
Fine-Tuning the Inputs
Smoothing K & D: Controls how much the SMI is smoothed. Lower values make the indicator respond faster but can introduce noise, while higher values produce smoother signals with a slight delay.
SMI EMA Length: Adjusts the sensitivity of the exponential moving average applied to the SMI. A lower value makes the EMA react more quickly, while a higher value slows it down for more stable signals.
Trend Lookback Period: Defines how far back the indicator looks to assess trend strength. A shorter lookback makes it more reactive to recent price movements, while a longer period smooths out fluctuations for a broader trend perspective.
Band Tilt Strengths: Determines how much the overbought and oversold levels shift in response to market trends. Increasing this value causes the thresholds to adjust more aggressively, making the indicator more sensitive to trend direction.
Opposite Band Compression: Controls how quickly the opposite band contracts when a trend reversal occurs. A higher value results in faster compression, making the indicator more responsive to sudden market shifts.
What Makes This Unique?
Unlike traditional Stochastic Momentum Index (SMI) indicators, which rely on fixed overbought/oversold levels, this version:
✔ Adjusts the SMI based on relevant volatility
✔ Adapts thresholds based on volatility & trend strength
✔ Incorporates multi-timeframe screening for trend confirmation
✔ Uses an MTF table for real-time, multi-asset tracking
Disclaimer
This indicator is for educational purposes only and is meant to support trading strategies—not replace independent analysis.
No financial guarantees are provided. Past performance does not guarantee future results. Always use proper risk management.
リリースノート
Volatility Based SMI with Dynamic Bands & MTF Screener by QTX Algo SystemsOverview
This enhanced version of the Volatility Based SMI with Dynamic Bands (VBSMI) expands on the original design by integrating a Multi-Timeframe (MTF) Screener. It maintains the core momentum detection and volatility-responsive adjustments of the standard VBSMI while providing expanded multi-timeframe analysis across multiple assets in a tabular format.
By allowing users to track momentum shifts, reversals, and trend conditions across multiple timeframes and multiple assets, this version enhances market awareness and helps traders make more informed decisions.
How It Works
Enhanced SMI Calculation
The core SMI calculation uses double smoothing through Exponential Moving Averages (EMAs) to refine price movements.
Inputs for Smoothing K and Smoothing D control how much noise is filtered.
A final SMI EMA is applied to help confirm momentum direction.
Adaptive Volatility Scaling
A fixed Bollinger Band Width Percentile (BBWP) calculation is used to create an Adaptive Adjustment Factor for the SMI.
This ensures the oscillator adapts to current volatility levels, making signals more context-aware.
Dynamic Threshold Adjustment
The overbought and oversold thresholds (default 50 and -50) adjust in real time based on market conditions.
These adjustments use three proprietary factors:
Trend Lookback Period – Determines historical trend strength using a VWMA-based comparison.
Upper & Lower Band Tilt Strength – Controls how aggressively the bands shift in response to trends.
Opposite Band Compression – Adjusts the speed of threshold contraction when trends reverse, making it more responsive.
Multi-Timeframe and Multi-Asset Screener (MTF) – New Feature
The integrated MTF Screener provides a real-time overview of the VBSMI's conditions across multiple timeframes and assets.
It includes:
✅ User-selectable timeframes (Default: 1H, 4H, 1D, 3D, 1W, 1M).
✅ Up to 6 additional tickers for multi-asset analysis.
✅ Real-time VBSMI color-coded conditions for easier signal interpretation.
How to Read the MTF Screener Table
Each cell in the table provides a momentum reading based on VBSMI conditions in different timeframes:
🟢 Green Background → Oversold Condition (Potential Buy Zone)
🔴 Red Background → Overbought Condition (Potential Sell Zone)
📊 Label: "Up" or "Down" → Shows whether VBSMI is above or below its EMA.
🟠 Orange Background → VBSMI crossovers from oversold/overbought conditions
How to Use & Adjust Inputs
Momentum Confirmation & Reversals
Use the dynamically adjusting thresholds to confirm when momentum is overextended or entering a new trend phase.
Monitor crossovers between the SMI and its EMA—these can be potential reversal or trend continuation signals.
Multi-Timeframe Trend Confirmation
Look for alignment across multiple timeframes in the MTF Screener (e.g., if the 1H, 4H, and 1D all show green, it strengthens a bullish case).
Use the multi-ticker feature to see how different assets align with your primary asset’s momentum signals.
Fine-Tuning the Inputs
Smoothing K & D: Controls how much the SMI is smoothed. Lower values make the indicator respond faster but can introduce noise, while higher values produce smoother signals with a slight delay.
SMI EMA Length: Adjusts the sensitivity of the exponential moving average applied to the SMI. A lower value makes the EMA react more quickly, while a higher value slows it down for more stable signals.
Trend Lookback Period: Defines how far back the indicator looks to assess trend strength. A shorter lookback makes it more reactive to recent price movements, while a longer period smooths out fluctuations for a broader trend perspective.
Band Tilt Strengths: Determines how much the overbought and oversold levels shift in response to market trends. Increasing this value causes the thresholds to adjust more aggressively, making the indicator more sensitive to trend direction.
Opposite Band Compression: Controls how quickly the opposite band contracts when a trend reversal occurs. A higher value results in faster compression, making the indicator more responsive to sudden market shifts.
What Makes This Unique?
Unlike traditional Stochastic Momentum Index (SMI) indicators, which rely on fixed overbought/oversold levels, this version:
✔ Adjusts the SMI based on relevant volatility
✔ Adapts thresholds based on volatility & trend strength
✔ Incorporates multi-timeframe screening for trend confirmation
✔ Uses an MTF table for real-time, multi-asset tracking
Disclaimer
This indicator is for educational purposes only and is meant to support trading strategies—not replace independent analysis.
No financial guarantees are provided. Past performance does not guarantee future results. Always use proper risk management.
リリースノート
We have added extra timeframes to the MTF Screener so users can now analyze very short term timeframes, and much longer timeframes also!招待専用スクリプト
このスクリプトは作者が承認したユーザーのみアクセス可能です。使用するにはアクセス申請をして許可を得る必要があります。通常は支払い後に承認されます。詳細は下記の作者の指示に従うか、QTXAlgoSystemsに直接お問い合わせください。
TradingViewは、作者を完全に信頼し、スクリプトの動作を理解していない限り、有料スクリプトの購入・使用を推奨しません。コミュニティスクリプトには無料のオープンソースの代替が多数あります。
作者の指示
If you would like access to this indicator, please contact QTX Algo Systems at contact@qtxalgosystems.com or visit qtxalgosystems.com
Contact us at contact@qtxalgosystems.com to access all of our tools and education or visit qtxalgosystems.com
免責事項
この情報および投稿は、TradingViewが提供または推奨する金融、投資、トレード、その他のアドバイスや推奨を意図するものではなく、それらを構成するものでもありません。詳細は利用規約をご覧ください。
招待専用スクリプト
このスクリプトは作者が承認したユーザーのみアクセス可能です。使用するにはアクセス申請をして許可を得る必要があります。通常は支払い後に承認されます。詳細は下記の作者の指示に従うか、QTXAlgoSystemsに直接お問い合わせください。
TradingViewは、作者を完全に信頼し、スクリプトの動作を理解していない限り、有料スクリプトの購入・使用を推奨しません。コミュニティスクリプトには無料のオープンソースの代替が多数あります。
作者の指示
If you would like access to this indicator, please contact QTX Algo Systems at contact@qtxalgosystems.com or visit qtxalgosystems.com
Contact us at contact@qtxalgosystems.com to access all of our tools and education or visit qtxalgosystems.com
免責事項
この情報および投稿は、TradingViewが提供または推奨する金融、投資、トレード、その他のアドバイスや推奨を意図するものではなく、それらを構成するものでもありません。詳細は利用規約をご覧ください。